The CCI indicator is a well-known and popular tool, on the basis of which a large number of expert advisors and trading strategies have been created. Previously, I have already described several such advisers, you can find them and.
CCI is an oscillator that allows you to identify overbought / oversold zones, as well as a weakening and strengthening trend.
Forex indicator CCI is often used to identify price peaks, as well as turning points of the prevailing trend. Strictly following his signals, you can enter the market at the moment of the emergence of a strong trend and exit at the moment of a change in direction. price level.
Algorithm for the operation of the CCI indicator
You can see exactly how the CCI indicator looks on a trading chart in the picture below.
The indicator is presented as a smoothed moving average that moves in the -100/+100 range. In situations where the instrument line is located above +100, this means that the market is overbought, and if it is below -100, it means oversold. In the first case experienced traders they try to open transactions for the sale of currency, and in the second - for the purchase of currency.
The authors of the tool advise creating orders to sell the currency if the indicator line certain time was in the overbought area, after which it crossed the +100 mark from top to bottom. It is recommended to open buy orders if the indicator line was in the oversold area for a certain time, after which it crossed the -100 level from the bottom up.
For a better understanding, I suggest you consider an example. It should be noted that at point 1 the price crossed the +100 level, as a result of which it ended up in the overbought zone. At this moment, it is too early to open sell deals, you need to wait until the indicator line crosses the +100 level again and goes down. The optimal segment for creating a sell deal is the interval marked with the number 2.
Setting the CCI indicator
In order for the indicator to work correctly, it must be configured correctly. The default setting is 14, which indicates the number of previous periods on which the calculation is based. This number can be changed depending on your preferences.
Important: if the number 14 in the standard settings is changed to a smaller value, then the indicator line will stay in the overbought / oversold zones for less time, and if it is changed to a larger value, the instrument curve will go beyond the levels less often.
Reducing the number of periods makes the instrument more sensitive. That is, the indicator will fluctuate between levels more often and will not linger near one of them for a long time.
By increasing the period, you make the indicator less sensitive. That is, the indicator line will enter the oversold/overbought areas less, but will stay near them for a longer time.
In the next picture, you can notice the fluctuations of the instrument curve with a period of 4.
I hope today's lesson will help you in increasing your profits in the Forex market. Subscribe to my newsletter, and you will always be aware of all the most and.
The Commodity Channel Index was created and first proposed by Donald Lambert in 1980. It measures the deviation of the price of an instrument from its average value. Despite the use of the word "commodity", in equally applicable to both commodity futures and stocks or currencies.
Despite the 37-year history and the presence of the indicator in all exchange trading programs, it is still inferior in popularity to such indicators as moving averages, the directional movement index, etc. This is due to the lack of literature on this indicator and Lambert's insistence on linking CCI to cycle theory.
It is not surprising that an extremely contradictory situation has developed around this indicator, which is expressed in diametrically opposite approaches to interpreting it. On the one hand, in many books on technical analysis and trading platforms The CCI indicator is described as an oscillator that serves to determine the overbought and oversold levels. On the other hand, the developer of the indicator himself created it as a trend-following tool that determines the moment of a strong and stable trend to open a position in the direction of the existing trend.
CCI indicator: how to use it
Based on the idea of D. Lambert, the indicator formula calculates a simple moving average from average daily prices (max+min+close/3), and then calculates the average deviation, which is the sum of the differences between the average price of each period and the simple moving average. The average deviation is then multiplied by a constant, which Lambert defined as 0.015, and divides the difference between today's price and the simple moving average. The result is represented as a number, which can be either positive or negative.
CCI = (P - MA(P, N)) / (k . MD)
P - price of the selected type
MA(P, N) - moving average of the selected type
k - selected coefficient
MD = ∑(|P(i) - m|, N) / N - standard deviation
m = ∑(P(i), N) / N
By changing the number of periods used to calculate the simple moving average, we can make the indicator either more sensitive and faster, or less sensitive, thereby smoothing out market volatility. As conceived by the creator of the indicator, the larger the CCI value, the stronger and, therefore, trading should go in the direction of the trend.
It is assumed that most of the random index values fall within the interval from +100 to -100. If the index value goes beyond the boundaries of this interval, then this is already considered non-random. Therefore, such strong movements indicate the emergence of a sustainable trend.
Trading signals
Lambert originally created the Commodity Channel Indicator to find the start and end of anticipated seasonal cyclical price patterns. He believed that fluctuations in the price of an instrument between the +100 and -100 lines are random and have no trading value. He suggested opening long positions only when the indicator goes above the +100 level. A significant drop below the +100 line, for example, below the zero line, is considered a signal to exit a long position. In turn, the rules for opening a short position suggest opening shorts when the indicator falls below the -100 level, and closing when it rises significantly above -100, crossing the zero line.

Despite the fact that the developer of the indicator himself saw it as a tool for identifying a strong trend, at present, in many trading platforms, this indicator is already presented as an oscillator that serves to determine the level of overbought or oversold. In this regard, the interpretation of signals for opening and closing a position is determined in a completely different way. In this case, when the indicator is above the +100 level, the market is overbought, therefore, the probability of a downward reversal increases. Therefore, as soon as the indicator, falling, crosses the +100 line from top to bottom, a signal comes to open a short. If the CCI indicator falls below the -100 line, then an oversold condition occurs. Therefore, as soon as the indicator, growing, crosses the -100 line from the bottom up, it is necessary to close shorts and open longs.

To the above types of signal interpretation, you can add another trend-following signal to open and close a position when the zero line is crossed. In this case (when the indicator crosses the zero line from the bottom up), it is necessary to open long position, and when crossing the zero mark from top to bottom, it is necessary to close long and open short.

Counts efficient use indicator Commodity Channel Index as a filter for entry. For example, if the indicator is above the level of +200, then it is not recommended to open long positions, since in this case the growing trend loses its strength. And vice versa, it is not recommended to open short positions, if the indicator is below the -200 level, since the falling trend in this case loses its strength significantly.
In addition, on this indicator, methods of working on divergences, using elements of graphical analysis in the form of plotting, reversal patterns and trend continuation are applicable.
Displaying CCI in QUIK terminal
To install the indicator on a price chart, you need to press the Insert key in the window of the analyzed asset to display the "Add chart" window. Then in the window that opens, in the list of available indicators, select and press the "Add" button.


To change the characteristics of the indicator, press the key combination Ctrl+E and select the CCI indicator in the left area in the Edit Chart Settings dialog box that appears. To change the color display parameters, you need to switch to the "Properties" tab, where in the "Line color" column you can select the color and line thickness of interest.

To change the CCI period, go to the "Parameters" tab of the "Edit chart settings" window. By default, the period is 9 candles.

To set the levels +100, -100 and 0, go to the "Levels" tab and in the "Enter a value" field indicate the level that you want to mark. After entering the levels, press the “Add” button, and for the changes to take effect, press the OK button.

conclusions
Based on the current guidelines for using the Commodity Channel Index and the descriptions of this indicator, it can be used either as a trend-following indicator or as an oscillator. At the same time, it should be taken into account that the results of testing the indicator by various experts both in Western and Russian stock market, showed that all methods of interpreting signals give a positive result, but the highest rates were in the case when CCI was used as an indicator, and an oscillator.
Commodity channel index - this is the full name of the CCI indicator. In Forex, the CCI indicator serves to measure the degree of deviation of the existing market value currency from its price in the average sense and the definition of trend reversals.
TOP 3 Forex Brokers in the world:
CCI on the daily chart of the EUR USD currency pair.
Fluctuations in CCI in the range of +100/-100% are random. Exits of index values beyond these limits are considered non-random. Such moments should be understood as signals to open a position.
In a statistical sense, CCI is an indicator of the normal distribution of instrument price deviations from average price indicators. This average price in the indicator is a simple moving average.
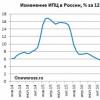
The distribution of indicator values is as follows.
The probability of CCI values going beyond +300 or -300 is no more than 0.1% for each direction. Curiously, this position can be easily confirmed by observing changes in the price movement at times of strong trend changes for daily timeframes.
Practicing traders know that the price in such cases "willingly" changes by one to one and a half figures, less actively - by two, and a movement of 300 points is a rare exception for most currencies.
Indicator signals
When observing the behavior of the CCI indicator, the following signals can be identified:
- indicator crossing one of the signal lines
- zero trading
- detection of divergences
- detection of graphic figures and support/resistance levels in the field of the CCI chart.
These signals can be used to make a trade.
Work at the intersection with the signal line
CCI buy signal.
In this case, a long position should be opened at the moment the CCI oscillator curve crosses the signal level - 100 from bottom to top.
CCI sell signal.
If this line crosses the +100 mark from top to bottom, you should perform a short short sale.
Zero trading
Zero CCI.
A long position is opened at the moment of overcoming the curve of the zero level indicator from the bottom up. A position to sell the traded asset is opened when the CCI line breaks through the zero level from top to bottom. Breakdown of the zero level is a confirming signal of the emergence of a new trend.
To strengthen the signal, you should wait for the price to go beyond the signal lines and then break through the levels +100 down or -100 up to the zero line.
This means that the crossing of one of the signal lines is the first signal, and the second, confirming it, is the crossing of the CCI zero level.
According to the logic of these two signals, you should enter the market at the zero level, ignoring the intersection of the signal ones. The second variant of the deal here may be opening a position from the signal lines after their intersection, but with a small lot, followed by an increase in the deal volume at the zero mark.
Divergence detection
Any oscillator serves as a tool for identifying divergences between its curve or histogram and the price chart. Divergence, in turn, is a sign of an upcoming reversal of the current trend. More detailed description its signs are in textbooks technical analysis. As for the CCI, it, like its counterparts, also regularly demonstrates the presence of such discrepancies between the price and the oscillator.

Divergence between price and CCI on the weekly chart of the EUR USD currency pair.
As for the figures of graphical analysis, secant, converging and other triangles, head and shoulders patterns, double, triple peaks and bases, "Murphy's saucers" and similar "graphics", as well as trend and support/resistance levels, then the capabilities of the oscillator allow an experienced "chartist" to easily build them in the indicator field.
CCI as a market entry filter
The CCI oscillator helps filter out entry points. So, if its line exceeds the +200 level, a long position should not be opened, as the market power weakens above this level.
For short short sales, one should not enter the market if the CCI line is above 0, because the increasing movement of CCI in the area from 0 to +100 signals a steady state of the current uptrend.
Strategies for CCI
There are several options for strategies using this indicator.
CCI with MACD and MA
Although, as shown above, the indicator itself generates a sufficient number of signals to be called a self-sufficient technical indicator, the “last word” still remains with the price, and its movement is best tracked by moving averages of different periods, fixing their divergences. convergence.
The best tool for this is the MACD histogram oscillator, whose bar movements almost completely coincide with the actions of the CCI line, although the latter reacts to price changes a little earlier than the MACD.
As moving averages, we use the standard for MACD 12 (red) and 26 (green) period exponential moving averages, but add a moving average with a period of 50 (yellow CC on the price chart) as a support/resistance level.

The break down of the zero level by the CCI indicator on the chart of the EUR USD currency pair coincides with the breakdown of the 50-period moving average. The MACD movings and its histogram reacted much later. The divergence of the moving averages and the breakdown of the MACD columns of the zero level appeared only after two candles.
However, taken together, these indicators gave several clear signals to open a sell trade. It is these signals, confirmed by several instruments, that are considered the most correct.
A buy signal for this strategy will be the CCI oscillator breaking through the -100 level from the bottom up, the price chart crossing the 50-period MA in the same direction, as well as the MACD bars breaking the zero level from the bottom up.
CCI and ZIG-ZAG
A popular price extreme tool that shows the beginning and end of a market wave, ZIG-ZAG can be another indicator for trading strategy with CCI oscillator.

ZIG-ZAG extremes.
ZIG-ZAG extremums at the breakpoints of its broken line coincide with the points where the Commodity channel index line crosses the +100 and -100 levels of the oscillator. Thus, the zigzag serves as an excellent filter for moving averages and the MACD histogram from the previous strategy.
About the usefulness of the indicator
The CCI index can bring a very significant benefit to the practicing trader. The indicator not only demonstrates price extremes, but also serves to determine the reversal of the current trend. Its signals allow you to detect entry points to a position with high accuracy.
The greatest efficiency of this indicator is achieved after observing it at different time intervals for different currency pairs. As a result of such work, each trader will accurately find for himself a trading asset and a time period for which he will be able to get from CCI the largest number trading signals.
Working on a long-term trend is more preferable with short-term ones for several reasons:
- The older the time period considered for the search for signals, the more likely it is to accurately enter the market and exit it with a guaranteed profit. Timeframes starting from four hours are more reliable for market analysis using the CCI indicator due to the absence of market noise, usually present on lower time frames.
- Possibility of making more profit.
- Work on the main trend, which was identified in the long term, involves minimal risks, because the entries into the transaction are carried out after the corrective movement after strong impulses on the indicator signal.
- All counter-trend signals are simply ignored, which also increases the effectiveness of trading through the selective quality of entry into a trade.
- The market is entered after a corrective, mainly flat movement. Namely, flat, when working with the described indicator, is the key to successful and accurate signals.
Daily CCI indicator
When trading on the daily charts, there is a high probability of missing an important new strong trend.
For this reason, in this situation, due to the high risks, this indicator is not applied on its own.
Additional trend indicators, such as ADX, serve as hints.
 Rules for working on daily time frames using the CCI indicator:
- Installation of necessary indicators with standard settings.
- Evaluation of the ADX indicator:
- If ADX is directed upwards, then a trend is emerging on the market, and further entry into the market should be carried out according to CCI signals.
- If ADX does not identify directional movement, then CCI signals must be ignored, they are false.
CCI indicator formula
To build an indicator, you need:
- Calculate the characteristic price by finding the arithmetic mean between the high, low of the candle and its closing price.
- And it is from the characteristic price that a calculation is made to build a moving average.
- Calculate the probable deviation based on the characteristic price of a certain number of candles.
- Finding values for building indicators by dividing the value for building a simple moving average by the product
Probable price deviation by 0.015.
Using the CCI indicator
The CCI indicator consists of a chart located in a separate window trading terminal. It is based on the moving average indicator. The base curve line is built according to a special calculation. CCI is located on two horizontal levels with values plus one hundred and minus one hundred, around which it fluctuates.
Indicator decoding:

Confirmation of CCI indicator signals
- Signals given by market oversaturation zones should be combined with technical levels support - resistance.
- When crossing the indicator levels, the following should form:
- reversal candlestick configurations;
- reversal graphic models;
- signals of additional indicators.
Description of the CCI indicator
CCI is a popular indicator used by many traders in successful trading, both as the main, basic and only signal to enter the market, and as an additional filter that discards unprofitable trades in advance.
CCI stands for Commodity Channel Index.
This indicator belongs to the class of oscillators, it provides the trader with the opportunity to predict the change in the market mood in advance, at the moments when neither the maximum nor the minimum of the price quotes chart has been formed yet.
Alternative trading with the CCI indicator
In accordance with alternative trade, you can right entrance into a deal, earn a good profit, due to an earlier entry, almost at the peak of the extremum in the direction of the main trend after the correction.
Trading rules:
- A signal to buy is the intersection of the indicator curve with the oversold line minus one hundred.
- Signal about sales when the curve exits the overbought zone with the crossing of the plus one hundred level.
- An exit from the market must be made at the moment the level curve touches plus or minus one hundred.
Trading with the CCI indicator at zero
The trading strategy with the considered indicator at zero belongs to the category of high-risk and aggressive.
This strategy is based on:
- crossing the zero mark, at the moment when the market transforms from bullish to bearish, and vice versa;
- catching a reversal moment, which can additionally be identified using candlestick analysis;
- the fact that when the price enters a strongly overbought zone or a strongly oversold one, a price reversal is guaranteed to be expected.
Working on the method under consideration implies several important rules:
- All signals are recommended to be considered only when the price has visited, or at least touched the line of overbought and oversold zones.
- Indicator setting. Its standard version does not provide a zero mark in the form of a line, so it must be configured using the "indicator properties" function.
- The entry signal is the intersection of the indicator curve with the level zero line.
- For purchases, you need to wait for the indicator line to cross the zero level from the bottom up.
- Sales will be signaled when the level crosses from top to bottom.
Disadvantages of the CCI indicator
 Despite the many positive properties in the considered indicator, it has a number of unpleasant qualities:
- It is difficult to select parameters for the indicator, since it was created and effectively applied by its creator only in cyclical markets, which is difficult to recognize without additional filters, since CCI belongs to the category of oscillators.
- In trending market conditions, CCI gives a lot of false signals that can completely destroy all earned profits when the market was in a flat state.
Therefore, it is important to identify the trend mood of the market from the flat one. This identification can be easily achieved with additional trend indicators:
- moving average with certain settings;
- Bollinger bands;
- parabolic SAR;
Instructions for trading with the CCI indicator
For the best concept and application of trading tactics, it is worth introducing the concept of indicator zones:

Trading instruction:
- If the indicator is in the overbought zone, then this signals a strong uptrend, and you need to look for entry points in the direction of purchases.
- If the indicator is in the oversold zone, then the market is dominated by downtrend, and you need to enter the trend in the bearish direction.
- When the indicator reverses in the overbought or oversold zones, it is necessary to close deals.
- When crossing the level plus one hundred and finding the chart in the range from zero to one hundred, it is necessary to open bearish trades.
- When crossing the level minus one hundred and finding the indicator in the range of zero - minus one hundred, it is recommended to open bullish orders.
The essence of the indicator is that, after certain calculations with price data, we get the indicator value, which fluctuates around zero. When the price of the analyzed financial instrument reaches a certain extreme level, then indicator value goes beyond [-100; 100]. Thus, those areas on the indicator chart where the Commodity Channel Index value exceeds 100 or falls below -100 signal to analysts that time to act. What exactly needs to be done when these extreme periods are reached, we will consider below.
Commodity Channel Index History
Read also Types of moving averages (SMA, EMA, WMA) There are three types of moving average lines: simple (eng. simple moving average, SMA) exponential (eng. exponential moving average, EMA...
Period n can be changed: the longer the period, the less volatile the indicator will be, and the more reliable it will be. And vice versa: the shorter the period, the more noise there will be on the indicator chart and more values will go beyond the critical range [-100; 100]. The choice of the period depends on the preferences of the analyst, the instrument itself, the time scale, etc. The author used a period of 20.
As a result of these rather cumbersome calculations, numbers with a positive and negative sign are obtained, about 70% of which are concentrated in the range [-100; 100].
The Meaning and Application of the Commodity Channel Index
- if the indicator value exceeds 100, then this means a strong uptrend in the market, and it is time to buy
- if the index falls below -100, then this is a sign of a bearish mood in the market and it is time to sell
But the followers of Lambert, who began to use the indicator on different financial instruments, revealed other properties of this indicator began to interpret and apply it differently.
Traders and analysts have found that the Commodity Channel Index is also good for detection of oversold and overbought areas, and, as a result, probable price reversals. Moreover, the discrepancy between the direction of the indicator movement and the direction of price movement, as in many other indicators, has also become relevant for CCI.
Currently, traders and analysts use the Commodity Channel Index technical indicator to detect three main signals:
- oversold and overbought zones
- discrepancies in price and indicator
- trend line reversals
Read also Bollinger Band Width (BB width) Bollinger Band Width is a technical indicator that allows you to detect the end of the current trend and the beginning of a new one. As you know, technical...
Now consider each of these types of signals in more detail.
Oversold and overbought zones
When the indicator value goes beyond [-100; 100], which means that the instrument is overbought or oversold. The indicator value should definitely return to the range in the near future.
When the index returns from the oversold or overbought zone to the [-100; 100], then this is a sign for sale and purchase, respectively.
The logic is quite simple: when the price is too high, it will soon settle down, i.e. go down. Such a price movement on the indicator looks like a downward crossing of the 100 line. And vice versa: if the price is undervalued, then it will soon rise. When the indicator crosses the -100 mark from the bottom up, it is settling time and you need to buy.
For greater reliability, you can wait until the indicator crosses the zero mark. In the picture above, pay attention to the blue translucent vertical line: the indicator went up from the oversold area and crossed the zero axis. It was a great moment to enter the market; after that point, the price rose for 2 months in a row.
Divergence in price and index movement
As with other technical indicators, if the index is moving up and the price is moving down, then the price is likely to move up soon. And vice versa: if the index moves down and the price moves up, then the price will probably start to fall soon.
The divergence can help especially if it coincides with the first signal: if the index starts to go down from the oversold zone, and at the same time the price of the instrument rises, this strong sell sign. And vice versa: if, after staying in the overbought zone, the index begins to grow, and the price falls at the same time, then this strong bullish sign.
Trend reversals
If you put on the indicator chart trend lines, then they can also be used as signals for action. When the trend line intersects with the index curve, it is a sign of a trend reversal.
If a downtrend intersects with an uptrend, then this buy sign, and if the ascending intersects with the descending area of the index, then this is a sign for sale.
Conclusion
Interesting technical indicator Commodity channel index, originally devised to detect volatility in commodity markets, can help detect overbought and oversold zones, and indicate the trend reversal points. Together with other indicators and signals, it can serve analysts well.