What the Net Reproduction Rate Says and Doesn't Say
With the exception of the very illiterate, those who talk about the demographic situation on the basis of general birth and death rates, then most people who are more or less seriously interested in demography know that in order to correctly judge what is happening, one must use more subtle meters. . These include, in particular, the total fertility rate, life expectancy and other functions of mortality tables, as well as gross and net reproduction rates.
An analysis of these indicators and their dynamics makes it possible to judge the changing reproductive situation, comprehend the various components of this situation, and makes it possible to compare the conditions for the reproduction of the population of countries or regions in time and space.
At the center of such an analysis is an indicator well known to demographers - the net coefficient (net coefficient) of the reproduction of the female population. It is equal to the number of girls born in a given period (usually one year, but another period can be chosen, for example, a five-year period, as is done in Table 1) and who have a chance to survive - at the age-related mortality levels of this period - to the average age of motherhood, calculated for the same period, per woman. The components of the calculation of the net coefficient for five-year periods, starting from the last five years of the 19th century and ending with the last five years of the 20th century, are given in Table. 1, changes in the net coefficient itself are also shown in fig. 1. The red line in the figure is the line of simple reproduction, the boundary that separates expanded reproduction from narrowed reproduction.
The last column of the table contains the so-called "true" coefficient natural increase, i.e. the coefficient of natural increase of a stable population corresponding to the age functions of fertility and mortality in each period. It shows with what annual coefficients the population can increase (decrease) due to natural growth, if an unchanged birth and death regime is maintained indefinitely for the calculation period indicated in the first column of the table.
Table 1. Components of the net reproduction rate of the female population and the "true" rate of natural increase in Russia over 100 years
|
Period |
Average number of children per woman |
including girls |
Average age of mother, years |
Probability of surviving to maternal middle age* |
Net reproduction rate (2x4) |
True coefficient of natural increase, ‰ |
AT late XIX- in the first decade of the 20th century, at best, only half of the girls born reached the average age of motherhood, however, with a birth rate of 7 or more children per woman, expanded reproduction of the population was steadily ensured in Russia - each new generation of girls was approximately 1 .5 times more than the maternal generation (the net reproduction rate fluctuated in the range of 1.5-1.6). As a result, the population could increase annually by 1.4 - 1.6% (the true coefficient of natural increase was 14.0 -15.5 ppm). The slow decline in the birth rate at that time was compensated by a gradual improvement in the survival of children's generations, so that the integral indicators of reproduction changed little.

Figure 1. Net reproduction rate of the Russian population during the 20th century
A smooth change in indicators is interrupted by the First World War and civil wars and accompanying famines and epidemics. The fall in the birth rate and a sharp deterioration in the situation with mortality caused a short-term demographic crisis. With a long-term preservation of the indicators of the reproduction regime recorded in 1915-1919, the population of Russia would decrease by 0.4% per year. Compensatory growth in the birth rate and noticeable successes in reducing mortality in the 1920s again restored the previous characteristics of population reproduction. The value of the net reproduction rate calculated for 1925-1929 is even higher than at the end of the 19th century - 1.7, which was almost a record value in the entire history of Russia.
In the 1930s, the trend towards a decrease in generational replacement rates, caused by a decrease in the birth rate (the situation with mortality practically did not improve), becomes predominant against the background of fluctuations caused by the forced "building of socialism" and famine. The Second World War, in turn, intensifies the fluctuations and causes another demographic crisis. The probability of surviving to the average age of motherhood again drops to 37%, and the birth rate - about 3 children per woman - turns out to be clearly insufficient to simply replace generations (the maternal generation was replaced by a generation 44% smaller in number - net reproduction rate population in the first half of the 1940s, according to our estimate, was 0.56). It is clear that if such a regime of reproduction is maintained, the population in the future would begin to decline rapidly - at a rate of at least 1.8% per year.
In the post-war years, the birth rate, after a short-term and inconspicuous compensatory growth, restored its downward trend. At the same time, the two post-war decades were marked by a sharp decline in infant mortality - the chances for a girl to become a mother increased rapidly to 90-95% by the early 1960s. Due to such a decrease in mortality, the reproduction regime in the 1950s - the first half of the 1960s still ensured a simple replacement of generations (each new generation reproduced the parent with an excess of 10-20 percent). However, even then the prospect of a transition to narrowed reproduction, when each new generation would be smaller in number than the parent, became more and more obvious.
Since the mid-1960s, the effect of reducing mortality has become insignificant. An increase in the probability of a newborn girl surviving to the average age of motherhood from 0.96 to 0.98 was not able to seriously affect the integral characteristics of population reproduction. The decisive factor in the change in reproduction rates in the last third of the 20th century and for the entire subsequent historical perspective is the birth rate. And it only for a short time, in the second half of the 1980s, rose to the level of 2.1 children per woman (the border of simple reproduction at the current level of mortality). Therefore, it is not surprising that since the mid-1960s, a reproduction regime has been established in Russia that does not even ensure a simple replacement of generations ("narrowed" reproduction). The fall in the birth rate in the 1990s further increased the degree of "underreproduction" (each new generation of children today is 30-40% less than the parent).
Since the population of Russia has not been reproduced for four decades, the prospects for its growth due to natural increase in the next two decades are negligible. In the absence of additional migration support and maintaining the birth rate of the second half of the 1990s, the population may decline at an annual rate of up to 1% per year, and, in the limit, up to 2% per year, as indicated by the natural growth rate. stable population (20.3 per 1000 population), shown in Table 1.
With all the analytical value given in Table. 1 and in fig. 1 indicators, they are also not perfect. These indicators refer to the so-called "conditional" generations and represent, in essence, nothing more than an assessment of the actual demographic conditions for the reproduction of the population in a given calendar year(and not a description of the actual course of the reproductive process, as is often thought).
The quantitative characteristics of the real reproduction of the population would correspond to these indicators only in that case if these conditions remained unchanged for a sufficiently long time. But in reality, they constantly fluctuate, and during the period of demographic transition they are subject to long-term and significant directed changes.
The popularity of indicators for conditional generations ("transverse" or transversal) is explained by the relative simplicity of their calculation. But to get a complete and deep understanding of what is actually happening with the reproduction of the population is possible only when it is possible to use indicators for real generations, or cohorts ("longitudinal", or longitudinal). It is these indicators, this time really describing the real course of the reproduction process, that are considered in the subsequent sections of this article.
However, if each of the women of reproductive age gives birth on average R daughters, this does not mean that the number of generations of daughters will be R times more or less than the number of generations of mothers. After all, not all of these daughters will live to the age at which their mothers were at the time of birth. And not all daughters will make it to the end of their reproductive years. This is especially true in countries with high mortality, where up to half of newborn girls may not survive until the start of the reproductive period, as was the case, for example, in Russia before the First World War 2 . In our time, of course, this is no longer the case (in 1997, almost 98% of newborn girls survived to the start of the reproductive period, but in any case), an indicator is needed that also takes into account mortality. Given the assumption of zero mortality until the end of the reproductive period, the gross reproduction rate of the population has hardly been published or used recently.
An indicator that also takes into account mortality is net reproduction rate of the population, or otherwise Beck-Kucinsky coefficient . Otherwise, it is called the net reproduction rate of the population. It is equal to the average number of girls born in a woman's lifetime and surviving to the end of the reproductive period, given birth and death rates. The net reproduction rate of the population is calculated using the following approximate formula (for data on five-year age groups):
where all designations are the same as in the formula for the gross coefficient, a 5 L x f and l 0 - respectively, the number of people living in the age interval (x+5) years from the female mortality table. The formula for calculating the net reproduction rate of the population uses the number of people living in the age interval (x+n) years from the female mortality table, and not a function of survival, i.e., not the number of those surviving to its beginning (lx), because it is an approximate formula. In rigorous demostatistical analysis and mathematical applications of demography, it is the survival function that is used 1(x).
Despite the somewhat "threatening" look, this formula is quite simple and allows without much difficulty, especially using the appropriate software, for example, Excel spreadsheets, calculate the value of the net reproduction rate of the population. In addition, many programs have been developed that make it possible to reduce the calculation of the net coefficient to a simple input of initial data. For example, the International Program Center of the US Bureau of Census (IPC of the U.S. Bureau of the Census) has developed a PAS (Population Spreadsheets Analysis) spreadsheet system, one of which (SP) is based on data on the values of age-specific fertility rates and the number of people living in the age interval (x+n) years calculates gross and net reproduction rates, as well as the true rate of natural increase and generation length, which will be discussed below 3 .
In table. 7.1 shows an example of calculating the age-specific fertility rate, gross and net reproduction rates of the population, in which the above software is not used. Using this example, as well as a similar example given in V.A. Borisov 4, one can easily learn how to calculate all the main indicators of population reproduction. But, of course, it is desirable to have at least some computer equipment, it is best, of course, to use the Excel program.
The calculation was made according to the following step by step procedure:
Step 1. In column 2 we enter the values of the age-specific fertility rates (5 ASFR X , taken in this case from the Demographic Yearbook of the Russian Federation for 1999 (p. 155**).
Step 2 Calculate the total fertility rate (TFR). For this number in the lines of column 2, divide by 1000 to express by age coefficients birth rate in relative shares 1 (in other words, we bring these values to 1 woman of the conditional generation). We enter the received private numbers in column 3. The sum of these numbers, multiplied by 5, gives us the value of the total birth rate equal to 1.2415 (highlighted bold italics). This, up to the third decimal place, coincides with the official data of the State Statistics Committee of the Russian Federation (1.242. FROM. 90).
Step 3 We calculate the gross reproduction rate (TO), or the number of daughters a woman has in her lifetime. To do this, we multiply the data in column 3 line by line by the proportion of girls among newborns (D). In this case, its average value for the period 1960-1998 was taken equal to 0.487172971301046. The sum of the numbers in column 4, multiplied by 5, gives the value of the gross reproduction rate equal to 0.6048. The same result can be obtained by simply multiplying the total fertility rate by the proportion of girls among newborns (1.2415 0.487 ... = 0.6048).
Step 4 In column 5 we enter the values \u200b\u200bof the numbers living in each age interval (x + 5 years (x = 15, 20,..., 45) from the mortality table for the female population of Russia for 1998. In column 6, these numbers are reduced to relative fractions of a unit by dividing them by the root of the mortality table (in this case, by 10,000). An alternative way is to average two adjacent values of the numbers of those surviving to the beginning of each age interval from 15 to 50 years from the mortality table for the female population for 1998 (p. 188). Multiplying the obtained averages by 5, we determine the number of people living in each age interval necessary for calculating.
Step 5. We calculate the net reproduction rate. To do this, we multiply the data in column 4 line by line by the numbers in column 6. Summing up column 7, we obtain the value of the net reproduction rate equal to 0.583. This value differs only by 0.002 from the officially published Goskomstat of the Russian Federation (0.585, p. 114 of the 1999 Demographic Yearbook).
The net reproduction rate is calculated for a conditional generation. As a measure of the replacement of the maternal generation by the generation of daughters, it is valid only for the so-called stable population, in which the mode of reproduction does not change, i.e. birth rate and death rate. The size of such a population changes (i.e. increases or decreases) in R0 once in a while T, called the average generation length.
Calculation of indicators of reproduction of the population of Russia for 1998 5
Table 7.1

Generation length
Generation length is the average time interval separating generations. It is equal to the average age of the mother at the birth of daughters who survive at least to the age in which their mothers were at the time of their birth.
To calculate the generation length, you can use an approximate formula, which is given in many demography textbooks 6:

where all designations are the same as in the previous formula. As can be seen from the formula, the desired generation length is obtained as the arithmetic mean of the ages of mothers at the birth of daughters (in this case, the middle of the corresponding age interval is used.), Weighted by the number (share) of the latter, surviving at least to the age at which their mothers were in the moment of their birth. Note that calculating the length of a generation is exactly the same as calculating the average age at birth of a child, which we did in the chapter on fertility. The difference is only in the weights used (when calculating the average age at the birth of a child, as you remember, age-specific fertility rates were used as weights) and in the fact that in this case we are talking not about all children born, but only about daughters, and only those of them who live at least to the age of their mother at their birth.
Let's return now again to tab. 7.1 and do the last, sixth step.
Step 6 We calculate the length of the generation, or the average age of the mother at the birth of daughters who live at least to the age at which their mothers were at the time of their birth. For this, the numbers in the lines of column 7 are multiplied by the middle of each age interval (column 8) and entered in column 9. The resulting products are the number of person-years lived by all daughters born to 1 woman of the conditional generation in this age interval and surviving at least to the age of their mother at the time of their birth. Summing these products, we get the numerator of the above formula for calculating the generation length, approximately equal to 14.8709. This number is the number of person-years lived by all daughters born to 1 woman of the conditional generation throughout her life and surviving at least to the age of the mother at the time of their birth. Dividing this last value by the number of all such daughters, i.e., by the net reproduction rate of the population (0.5859), we obtain the required length of the female generation in Russia in 1998. For the data we have chosen, it is equal to 25.38232512 years, or rounded 25 ,38 years old.
True Rate of Natural Increase As mentioned above, the net reproduction rate of the population (R0) shows that the size of a stable population, corresponding to the real one with given general birth and death rates, which are assumed to be unchanged, changes (i.e. increases or decreases) in R 0 times per time T, i.e., for the length of a generation. Taking this into account and accepting the hypothesis of exponential growth (decline) of the population, we can obtain the following relationship linking the net coefficient and the generation length. This ratio is derived from the following equation: P T \u003d P () R 0 \u003d P 0 - e g T (remember chapter 3, that section of it that talks about population growth and growth rates):
![]()
In the theory of a stable population, r in these expressions is called the true coefficient of natural population growth (or A. Lotka's coefficient). This coefficient is the root of the so-called integral equation of population reproduction, or Lotka's equation 7 . It is widely used in mathematical applications of demography, in particular in the theory of a stable population. However, we do not consider this equation here, since this topic is beyond the scope of our manual. Those interested are referred to the Demography Course, ed. AND I. Boyarsky (M, 1985. S. 90-91 and 103-118), as well as to the corresponding articles of the Demographic Encyclopedic Dictionary (M., 1985) and the Encyclopedic Dictionary "Population" (M, 1994). For a very close approximate solution of the Lotka equation with respect to the true coefficient and generation length, as well as a computational procedure, see: Shryock H.S., Sigel J.S. The Methods and Materials of Demography / Condensed Edition by E.G. stockwell. N.Y., San Francisco, London, 1969. P. 316-31.8.
Lotka Alfred James (1880-1949), American biologist and demographer. [...] President of the American Population Association (1938-1939), the American Statistical Association (1942) ... In 1907, he showed that a population that grows at a constant rate and maintains an unchanged order of extinction tends to a certain age composition and is constant / and birth and death rates. ... For the first time proposed, the mathematical expression of the natural growth rate of a closed population with permanent order extinction and childbearing, the algebraic expression of which was given in the work “On the True Coefficient of Natural Population Increase” (1925), showing the relationship of this coefficient with the net reproduction rate of the population ... Lotka studied the process of generational change, gave a modern analytical expression for the length of a generation ...
Population. Encyclopedic Dictionary. M., 1994. S. 210.
The last formula, proposed by the American demographer E. Cole, already familiar to you from the chapter on fertility, in his article "Calculation of approximate true coefficients" 8 , can be used to estimate the true coefficient of natural population growth, given that, as mentioned above, the length of a generation is the average the age of the mother at the birth of daughters surviving at least to the age of their mothers at the time of their birth. AT modern conditions the length of a generation does not differ too markedly from the average age of a mother at childbirth*. Therefore, the evaluation of the last parameter by any method allows one to approximately establish both the sign and the value of the true rate of natural increase.
If we now use E. Cole's formula and divide the just calculated length of the female generation by the natural logarithm of the net reproduction rate (lnO.5859 \u003d -0.534644249954392), then we get the true rate of natural increase of the population of Russia for the conditions of 1998. This value is -0.0210636435922121, or =-2.1%.
The real value of the coefficient of natural increase of the population of Russia in 1998 was equal to -0.48%, or almost 4.4 times less in absolute value. This difference is due to the relatively high proportion of women of reproductive age in the Russian population, which, in turn, is associated with a certain increase in the birth rate in the first half of the 1980s. of the last century and with the influence of previous demographic waves. The real age structure of our country is younger than the age structure of a stable population corresponding to modern parameters of fertility and mortality. The population has accumulated some growth potential, or, more precisely, the potential for a slowdown in population decline, whereby our country's population is not declining as rapidly as it would otherwise.
But this situation will end very soon. Generations born during the period of the birth rate decline that began in the second half of the 1980s will begin to enter reproductive age. last century and continues to this day**. And then the potential for demographic “growth” will be exhausted, and the natural decline in the population of our country, if no measures are taken, will be even faster (in 4 -5 times faster than now). And no replacement migration, which some demographers rely on, will not save our country from the horrors of depopulation.
For example, in the same 1998, the average age of a mother at the birth of a child, according to S.V. Zakharov, was 25.34 years. See: Population of Russia 1999. Seventh annual demographic report/ Rev. ed. A.G. Vishnevsky. M., 2000. P. 55. The State Statistics Committee of the Russian Federation gives a value of 25.3 years (see: Demographic Yearbook of the Russian Federation 1999. P. 170).
The increase in the number of births in the last two years is nothing more than an artifact.
Although, strictly speaking, the net reproduction rate is a measure of the replacement of the maternal generation by the generation of daughters, it is usually interpreted as a characteristic of the replacement of generations in the entire population (not just women). At the same time, the nature of the replacement of generations (reproduction of the population) is assessed in accordance with the following rule:
The clarification "after a time equal to the length of a generation" is very significant. If a R0< 1, this does not yet mean that in the year for which the net reproduction rate is calculated, there is a decrease in the population, absolute numbers of births and the total birth rate. The population can grow for quite a long time, despite the fact that the value of the net coefficient is less than or equal to 1. This has been the case, for example, in Russia since the late 1960s. until 1992. The value of the net coefficient in our country was less than 1 all these years, respectively, the true coefficient of natural increase was negative, and the population increased due to the potential for demographic growth accumulated in a relatively young age structure. Only when this potential turned out to be exhausted (and this happened just in 1992), the birth rate became less than the death rate, and the population began to decrease numerically.
We can say that the depopulation in Russia has changed from latent, latent to overt and open. And this did not depend at all on the specific political and socio-economic situation of the 1990s. of the last century, no matter what the so-called "nationally concerned scientists" and self-styled "patriots" of any color, from the ultra-left to the ultra-right, may say. The beginning of depopulation in our country was predetermined by the processes that took place in the population throughout the 20th century, especially in post-war period when there was a sharp drop in the need for children, which caused a rapid and deep drop in the birth rate. So, in fact, it happens in all developed countries Oh. Approximately one third of the world's countries have a birth rate that is less than what is necessary for simple reproduction of the population. In other words, in these countries, as in Russia, there is a hidden or obvious depopulation. And most of these countries are those in which the standard of living of the population is much higher than in our country.
In the previous paragraph, it was said about the birth rate necessary to ensure simple reproduction of the population. In this regard, the question arises of how to determine this level of fertility. Various methods are used to answer it.
One of them was proposed by V.N. Arkhangelsk 9 . The method is based on a simple comparison of the actual total birth rate with its conditional value equal to the total death rate. The ratio of the second to the first shows (in fact, this is the reciprocal of the vitality index, which was discussed at the beginning of the chapter), how many times more the value of the total birth rate must be in order to ensure zero natural population growth with a given mortality rate and the current age structure:
![]()
where TFR h , TFR a , GMR, GBR- respectively, the hypothetical total birth rate necessary to ensure simple reproduction, the current total birth rate, the total death rate and the total birth rate.
Gross and net ratios make it possible to answer this question differently, but it is also quite simple. To do this, either the ratio of the net coefficient to the gross coefficient, or the inverse ratio, is used.
The first ratio, i.e. the ratio of the net coefficient to the gross coefficient (R0 / R), shows what the level of potential reproduction of the population is, or otherwise, how many women in each next generation replace women of the previous generation per one born girl 10 .
Inverse ratio, i.e. the ratio of the gross coefficient to the net coefficient (R/R 0), shows how many girls a woman of a conditional generation needs to give birth to ensure that simple reproduction of the population is guaranteed. It is usually denoted by the Greek letter r:
In particular, for our example (see Table 7.1):

From here it is easy to obtain the value of the total birth rate required to ensure simple reproduction of the population. To do this, you just need to divide this expression by the proportion of girls among newborns, that is, by the secondary sex ratio:
Calculation by the method of V.N. Arkhangelsky gives the value of the total fertility rate necessary to ensure simple reproduction, approximately equal to 2.04, which is much less. Apparently, this difference is affected by the fact that the method associated with the use of gross and net coefficients gives the ratio of births and deaths in its pure form, and in the method of V.N. Arkhangelsky, the role of the age structure is also taken into account. It is interesting to compare the dynamics of the hypothetical total fertility rate (TFR h), calculated by these two methods, for 1996-1998.
If we use the calculations of V.A. Borisov, it turns out that the value of the hypothetical total fertility rate (TFR h), calculated by the method of V.N. Arkhangelsky, in 1996 was equal to approximately 2.05, i.e. we have a decrease by 0.01 over two years. The calculation alternative method gives for 1996 the value TFR h , equal to 2.12, which, on the contrary, is 0.01 more than 11. As you can see, the dynamics of the hypothetical total fertility rate calculated by various methods turned out to be the opposite. Under conditions of decreasing mortality at that time, this difference can be explained both by a certain rejuvenation of the age structure of the reproductive contingent, and by an increase in the gap in the dynamics of fertility and mortality (the birth rate continued to fall even faster than before, and the mortality rate also decreased somewhat, but not in the same proportion ).
In Russian literature, r is sometimes called at the cost of simple reproduction. It is believed that its value characterizes the so-called. "economical" reproduction of the population, or the ratio of demographic "costs" and "results"."Costs" are respectively measured by the gross coefficient, and "results" - by the net coefficient. Moreover, the lower the value of p and the closer it is to 1, the more "economical" is the reproduction of the population 12 . The application of allegedly "economic" terminology to the reproduction of the population seems somewhat strange (it is not clear what to do with ethics). In addition, it seems that the name of this indicator ("price of simple reproduction"), and its interpretations in the mouths of many of our demographers are needed only to prove to ourselves and readers that the situation with reproduction in our country is far from one that could cause alarm. What, in fact, to worry about, if the value of p in our country is practically the same as in advanced countries of the West. We, so to speak, if not ahead of the planet then, by at least, in the forefront progressive humanity.
Being involved in progress is, of course, impressive. But the question arises whether this is progress. Can the inexorable and rapid fall into the abyss of depopulation be called progress? Unfortunately, many demographers either ignore these damn questions, or relate to the negative demographic dynamics in our country, at best conciliatory, and at worst, even believing modern demographic trends(especially the situation with fertility) something quite normal.
All the indicators of population reproduction described above refer to the female population. However, in principle, similar indicators (gross and net reproduction rates, true rate of natural increase, length of the male generation, etc.) can be calculated for the male population, as well as for the entire population. Analysis of the reproduction of the male population in recent years has become increasingly widespread in demography. We have already discussed one of the successful examples of this kind of analysis done by V.N. Arkhangelsk. However, their consideration is beyond the scope of our book.
Keywords
Population reproduction, replacement of generations, reproduction mode, vitality index, gross coefficient, net coefficient, stable population, true natural increase coefficient, Lotka coefficient, generation length, simple reproduction, narrowed reproduction, expanded reproduction, price of simple reproduction.
Review questions
1. What is the relationship between the concepts of natural increase (decrease) of the population and reproduction of the population?
3. What is the difference between gross and net reproduction rates?
4. What is the Lotka ratio and what exactly does it mean?
5. How is the "price of simple reproduction" calculated? What is the methodological role of this indicator?
The growth and reproduction of the population are determined by the ratio between the numbers of births and deaths, or, in other words, between the levels of fertility and mortality. The word "natural", as mentioned earlier, in this case is conditional, intended to designate exactly this ratio between fertility and mortality, in contrast to changes in population due to migration processes. There are similarities and interactions between population growth and reproduction. But there is a significant difference between these concepts. In particular, the population may continue to grow for a long time, while the reproduction of the population has already become narrowed (that is, each subsequent generation is numerically smaller than the previous one). This situation is explained by the fact that the age structure carries some potential for demographic growth.
On the contrary, the population may continue to decrease even under the regime of its expanded reproduction (if the share of the reproductive part of the population becomes too small compared to the share of its elderly part. Then the number of births, even with a very high birth rate, could not compensate for the large number of deaths). And this is explained by the same potential for population growth, which is carried by the age structure of the population, but with a negative sign (in the algebraic sense).
7.1. General coefficient of natural increase
Population growth (or increase, which is actually the same thing) is characterized by a number of indicators, the simplest of which is the general coefficient of natural increase already known from Chapter 4. Let me remind you that this coefficient is the ratio of the natural increase of the population to its average (most often average annual) number. Let me also remind you that natural increase is the difference between the number of births and deaths in the same period of time (usually a calendar year) or the difference between the general birth and death rates.
The coefficient of natural increase has all the same advantages and disadvantages as other general coefficients. Its main drawback is the dependence of the value of the coefficient and its dynamics on the characteristics of the age structure of the population and its changes. It should be noted that this dependence of the coefficient of natural increase on the age structure is even much more significant than other general coefficients. It is, as it were, doubled by the simultaneous influence of the age structure on the levels of fertility and mortality in opposite directions. Indeed, say, in a relatively young population, with a high proportion of young people from 20 to 35 years old (when the first and second children are born, the probability of birth of which is still quite high today, and the probability of death at these ages, on the contrary, is small) even with a moderate birth rate, there will be a relatively high number of births (due to a large number and share in the total population of young married couples) and at the same time - for the same reason, due to the young age structure - a relatively smaller number of deaths. Hence, the difference between the number of births and deaths will be correspondingly greater, i.e. natural increase and coefficient of natural increase. On the contrary, with a reduction in the birth rate and as a result of this reduction - the aging of the age structure - the number of deaths will increase (while the death rate in each age group may remain unchanged or even decrease), and ultimately the natural population growth and the natural increase rate will decrease. . It is the latter that is happening in our country, as well as in other economically developed countries with low birth rates.
The dependence of the value of the general coefficient of natural increase on the age structure of the population must be taken into account in comparative analysis when comparing such coefficients for countries or territories with populations that differ from each other in the nature of their demographic development and, accordingly, in the nature of their age structure.
One of the ways to eliminate this shortcoming, bringing the compared coefficients of natural increase to a comparable form, can be the index method already known to the reader and methods of standardizing general coefficients. The scope of this textbook does not allow to consider these methods here (but they can be found in reference books on statistics and in other scientific literature).
Another way to improve the quality of measuring the level of population dynamics is to move from natural increase to the calculation of population reproduction indicators. The advantage of these indicators is their independence from the structure of the population, primarily from age and sex.
Specifically, the method of standardization of natural growth coefficients is considered, in particular, in the article: Borisov V.A. Standardization of the coefficient of natural increase of the population // Demographic factors and standard of living. / Ed. D.L. Broker and I.K. Belyaevsky. - M., 1973. S. 376-379.
7.2. Population reproduction indicators
There are several such indicators, two of them are gross and net reproduction rates of the population. In contrast to the rate of natural increase, these indicators characterize the change in the population not for a year, but for a period of time during which the parental generation is replaced by the generation of their children. Since the replacement of generations is characterized by the ratio of birth and death rates, and the latter differs significantly between male and female sexes, population reproduction rates are calculated separately for each sex, more often for women. Usually, this does not take into account the external migration of the population, i.e. the so-called closed population (conditionally not subject to external migration) is considered.
The gross reproduction rate of the population is calculated in the same way as the total fertility rate, but unlike the latter, only girls are taken into account in the calculation. In the form of a formula, the calculation can be represented in the following way:
(7.2.1)
where r1
-
gross reproduction rate of the population; TFR - total fertility rate; d - proportion of girls among newborns.
Thus, the gross reproduction rate of the population shows the number of girls that an average woman gives birth to in her entire life. It is assumed that none of the women and their daughters die before the end of the reproductive period of life (conditionally - up to 50 years). Obviously, the assumption of no mortality is too unrealistic for the gross coefficient to be of any use for analytical work. Indeed, in recent years this indicator has not actually been used. If we take into account the impact of mortality on the degree of population reproduction, then we turn to the net population coefficient. It is calculated according to the following formula: ![]() (7.2.2)
(7.2.2)
where R0
-
fx -
FLx- the number of living women from the mortality tables, which serve as an adjustment for mortality (or for survival to a certain age, which in this case is the same); l0
- "root" of the mortality table, equal to 100000 or 10000, depending on its digit capacity; d - proportion of girls among newborns; P - the length of the age interval (usually either 1 or 5).
Traditionally, the coefficient is calculated on average per woman, so there is a factor of 0.001 in the formula. But it is possible to calculate an average of 1000 women. This, again, as in the case of the names of indicators of population reproduction, is a matter of the user's arbitrary choice.
The net reproduction rate of the population characterizes the replacement of the generation of mothers by the generation of their daughters, but is often interpreted as an indicator of the replacement of generations in the entire population (both sexes together). If this coefficient is equal to 1.0, this means that the ratio of birth rates and death rates ensures a simple reproduction of the population after periods of time equal to the average age of mothers at the birth of daughters. This average age varies slightly in direct proportion to the height of the birth rate, between 25 and 30 years of age. If the net coefficient is more or less than 1.0, this means, respectively, expanded reproduction of the population (the generation of children is numerically larger than the parental one) or narrowed (the generation of children, taking into account their survival to the average age of the parents, is numerically less than the parental one).
The average age of mothers at the birth of daughters (more precisely, at the birth of daughters who, in turn, live to at least the age of their mothers at the time of their birth. But this condition is pronounced so long that almost everyone, even the most strict experts, omit it ), also called the length of the female generation, approximately calculated by the formula:  (7.2.3)
where T - the length of the female generation (the average age of mothers at the birth of daughters); fx -
age-specific fertility rates; FLx -
number of living women from mortality tables; d - proportion of girls among newborns; X - age at the beginning of the age interval; P- length of the age interval in years.
Since in the above formula the indicators of the length of the age interval (P) and the shares of girls among newborns (d) are included in both the numerator and denominator of the fraction, they could obviously be reduced. But in practice it turns out that this is not necessary (the number of columns in the calculation table increases unnecessarily).
It is easy to see that the denominator of the above formula contains the expression of the net reproduction rate of the population, and in general, the formula expresses the arithmetic mean of the average ages for each five-year age interval, weighted by the proportion of newborn girls who live to the age of their mothers at the time of their birth.
An example of calculating the net reproduction rate of the female population of Russia for 1996 and the average age of mothers at the birth of daughters is given in Table 7.1.
Consider the calculation algorithm by its stages:
1) are written out from the Demographic Yearbook of Russia (M., 1997. P. 215) in column 1 of table 7.1, age-specific fertility rates, while they are converted from ppm to fractions of a unit (by dividing each by 1000);
2) multiplying each of the age-specific fertility rates by the share of girls among newborns (assuming it is the same in all age groups of mothers), we obtain the age-specific birth rates of girls, which are recorded in column 2;
3) according to the tables of mortality of the population of Russia for 1996 (See Demographic Yearbook of Russia. M., 1997. P. 250), the number of people living in each age group is determined as the arithmetic mean of two adjacent numbers of those surviving, i.e.: ![]()
where FLx- the number of living women, calculated according to the tables of mortality; lx and lx+5- the number of surviving to age X and x+5 from the same mortality tables.
The numbers of living obtained in this way are divided by the root of the mortality table l 0 (in this case it is equal to 100000) and are entered in column 3 of table 7.1;
5) age-specific birth rates of girls from column 2 are multiplied line by line by the number of living women from column 3 (i.e., a correction is made for their survival to the age of mothers at which they gave birth to these daughters). The multiplication results are recorded in column 4;
6) the indicators of columns 1, 2, and 4 are summed up vertically, and the sums are multiplied by 5 (by the length of the age intervals). As a result, in column 1, the total fertility rate is obtained TFR = 1.2805, or rounded 1.281; in column 2, the gross reproduction rate of the population, equal to 0.625, and in column 4, the net reproduction rate of the population R0
=
0.60535, or rounded 0.605.
Naturally, it is interesting to compare the obtained results with the official publications of the Goskomstat of Russia, which are calculated in the most accurate way on the basis of one-year age coefficients. It turned out that the total fertility rate calculated by us for Russia for 1996 exactly coincided in size with the calculated by the State Statistics Committee of Russia - 1.281. The value of the net coefficient diverged from the calculations of the State Statistics Committee by only 0.002. Such a discrepancy can be considered insignificant.
Let us return to Table 7.1 and now determine the average age of mothers at the birth of daughters - the length of the female generation. For this you need:
7) multiply the data in column 4 line by line by the age indicators in the middle of each five-year age interval (in column 5), and write the results of this multiplication in column 6. After summing the products obtained and multiplying the sum by 5, we obtain the numerator of the fraction (15.1237), dividing which by the net reproduction rate of the population (0.60535), we get the indicator of the length of the female generation in Russia in 1996, equal to 24.98 years (or rounded - 25 years).
The net reproduction rate of the population makes it possible to assess the state of the actually existing in each this moment the time of the population reproduction regime (the ratio of birth and death rates in their abstraction from the impact of the sex and age structure of the population) from the standpoint of its probable further development. It characterizes not today's demographic situation, but its limiting state is in some future, if the given mode of reproduction remains unchanged. In other words, the net coefficient is a tool for assessing the situation and predicting its future trends.
Table 7.1
Calculation of the net reproduction rate of the population
Russia for 1996 and the average age of mothers at
the birth of daughters
Age groups |
fx/ 1000 |
Gr. 1 x |
(gr. 2 x gr. 3) |
x + 0.5n |
(x + 0.5p) X |
|
On the basis of the net coefficient and the length of the female generation, one can determine the so-called true rate of natural population growth, which characterizes the population growth for each year, but, like the net coefficient, does not depend on the characteristics of the age structure of the population. The true coefficient of natural population growth is approximately determined by the formula proposed by the American demographer Ansley Cole in 1955: ![]() (7.2.4)
(7.2.4)
where r -
the true rate of natural increase of the population; R0
-
net reproduction rate of the population; T - the length of the female generation (the average age of mothers at the birth of daughters).
For example, let's define this coefficient for Russia in 1996 according to Table 7.1. ![]() - (minus) 20.1 ‰.
- (minus) 20.1 ‰.
The actual rate of natural increase in Russia's population in 1996 was -5.3‰. From this one can see what role the age structure continues to play in the growth of our population and what will be the annual decline of our population when the age structure finally loses its potential for demographic growth.
In 1996, an interesting and simple method for assessing population reproduction was proposed by the Russian demographer V.N. Arkhangelsk. The method consists in determining the hypothetical birth rate necessary to ensure zero natural population growth in the conditions of the actual mortality rate and the actual age structure of the population. The hypothetical birth rate in this case is expressed by the total fertility rate.
The proposed method is easier to show on specific example. As is known, the natural increase is equal to zero in the case of equality of the numbers of births and deaths (and, accordingly, the total birth and death rates). In 1996, the crude mortality rate in Russia was 14.2. Therefore, to ensure zero growth, the total fertility rate would have to be the same, i.e. 14.2. In fact, its value in the same 1996 was only 8.9, or 1.6 times less. Since the age structure in this case is taken as it really is, it turns out that in order for the total birth rate to be equal to the total death rate, it is necessary to increase the age-specific birth rates and, as a result, the total birth rate also by 1.6 times. compared to the actual one.
The actual total fertility rate in Russia in 1996 was 1,281 children (per woman). From here we can determine the value of the total birth rate, which, given the current level of mortality and the current age structure of the population, could ensure zero growth in the population of our country. This value should be 2.05 for the conditions of 1996. Not a very large value, which indicates a positive (for the conditions of 1996) influence of the age structure of the population. By the way, this positive influence age structure also indicates the right time to activate the pronatalist (i.e., aimed at stimulating the birth rate) population policy. The effect could be achieved at a lower cost.
Although the described method by V.N. Arkhangelsky is very simple, it reveals quite well the scale of the task facing our entire society in overcoming the demographic crisis.
Some experts prefer to call these indicators "gross" and "net" population reproduction rates (instead of "gross" and "net", respectively). It seems to me that there are no serious grounds for preferring the names of reproduction indicators. I guess it's just a matter of personal taste. The names I have chosen seem preferable only because they have fewer associations with other familiar concepts.
See Family and family policy in the Pskov region / Ed. N.V. Vasilyeva and V.N. Arkhangelsk. - Pskov, 1994. S. 180-181.
7.3. Birth rate ratio
and mortality in the dynamics of population reproduction
Today, among domestic experts, the issue of the role of fertility and mortality in the reproduction of the country's population is being discussed. recent years. Which problem is more acute: low birth rate or relatively high death rate? What problem should be solved first? Meanwhile, it seems to me that the answer to this question is not difficult to obtain using the index method already known to us. Let us return again to the net reproduction rate of the population. It is the best indicator of population reproduction precisely because it is formed as a ratio of only two components of fertility and mortality. Other factors, primarily the age structure of the population, are not present in the formula for calculating it. From here, using a simple system of indices, one can show to what extent the change in the value of the net coefficient for any period of time is due to a change in the birth rate, and to what extent - to the death rate.
Consider the change in the net reproduction rate of the population of Russia for the period from 1986-1987. through 1996 inclusive. The choice of this period is due to the following circumstances. Increasing since the late 1970s, the net coefficient reached by 1986-1987. maximum (1.038), and then began to decline, reaching in 1996 the value of 0.603.
Let us build a system of indices characterizing the components of the change in the net reproduction rate of the population of Russia for the period from 1986-1987 to 1996, using its standard formula (7.2.2).  (7.3.1)
For the calculation it turns out to be sufficient to calculate only one element of equation (7.3.1), which is a net coefficient at the level of birth rate in 1996 and mortality in 1986-1987. (i.e., assuming a constant mortality rate in the decade 1986-1996).
Turning again to the system of indices (in the right extreme part of Equation 7.3.1), we note that the first of the two indices characterizes the change in the value of the net coefficient due to changes in the birth rate, the second - due to changes in mortality.
The calculation results are presented in Table 7.2. Under our hypothesis of a constant mortality rate in 1986-1987. and the actual birth rate in 1996, the net reproduction rate of the population in 1996 would have been 0.606. In fact (that is, with actual mortality in 1996), it was equal to 0.603. Already from this, frankly, insignificant difference, we can draw a conclusion about the role of the increase in mortality in the decade we are analyzing. But let's finish our calculation.
Table 7.2
Net reproduction rate calculations
population of Russia at the birth rate of 1996 and
various hypotheses about the mortality rate
|
Age |
Age |
The five-year sums of the numbers of living women from the mortality tables for various |
F X x FL X |
||
74.6 years |
80.0 years (type tables) |
gr. I xGp. 2 |
gr. I xGp. 3 |
||
R0 = |
|||||
Let us substitute the known and calculated values of the net coefficients into the index system (7.3.1):
Subtracting the obtained indices from 1, and converting the results into percentages, we determine the change in the net coefficient in the structural expression:
-41,9% = -41,6% - 0,5%.
After adjustment, we get: -41.9% = - 41.4% - 0.5%.
Final conclusion: for the period under review 1986-1996. The net reproduction rate of the population of Russia decreased by 41.9% as a whole, including 41.4% due to a decrease in the birth rate and 0.5% due to an increase in mortality. If we take the overall decrease in the net coefficient as 100%, then 98.8% of this decrease is due to a drop in the birth rate and only 1.2% - an increase in mortality.
Now suppose that the average life expectancy of Russian women suddenly rose to 80 years, already achieved in a number of advanced countries in this respect (this is the level achieved in the Scandinavian countries, in France, surpassed in Japan), but the birth rate would remain at the level of 1996. Then the value of the net coefficient would be 0.621 (column 5 of table 7.2.), i.е. would increase by only 3.0% compared to the actual in 1996.
From this simple calculation, one can see that the role of today's, not very prosperous, mortality in our country in changes in the reproduction of the population is very small. By this I do not at all want to belittle the importance of the struggle with death. No, of course, social, economic, political and so on. The significance of this struggle is undeniable. But the demographic significance is negligible. Today, the main factor on which the demographic future of our country depends entirely is the birth rate.
CHAPTER 8
POPULATION REPRODUCTION
8.1. The concept of population reproduction and its indicators
The process of population reproduction is a continuous change of generations of people. As a result of births and deaths, parental generations are constantly being replaced by generations of their children. If generations of parents are replaced by more numerous generations of children, then they speak of expanded reproduction. If the generations of children are small relative to the parental generations, then in this case reproduction is narrowed. Where the numbers of parental and child generations coincide, we are talking about simple reproduction.
Sometimes population reproduction is identified with population growth. But the demographic dynamics depends not only on the reproduction of the population, but also on migration processes. Only in the case of a closed population, if there are no external migrations, as was practically the case in the Soviet Union, demographic growth is entirely determined by the reproductive processes. An ideal example of a closed population is the population of the entire globe.
The category "reproduction of the population" entered the scientific circulation at the beginning of the 20th century. Already at the turn of the 20-30s. it was actively used by Soviet scientists. But almost immediately, specific features emerged in the interpretation of population reproduction in domestic science, which have survived to this day. Unlike foreign researchers, domestic demographers placed more emphasis on the “socio-historical” conditionality of the generation replacement process. In addition, in the 1960s and 1980s expansive interpretations of this term have been proposed. The reproduction of the population was presented as a combination of three forms of movement: natural (birth and death), spatial (migration) and social (changes in social structures, social and professional mobility, etc.). Some demographers attribute migration to reproductive processes in addition to fertility and mortality. However, it is unlikely we can talk about the replacement of parental generations by generations of their children, since migrants in their majority represent the population of another territory. It is an independent source of demographic dynamics.
The definition of population reproduction as a process of replacement of generations suggests that some special "generational" indicators should be its meters. The most common quantitative characteristics of reproduction, due to their simplicity and the availability of statistical information, are natural increase and the coefficient of natural increase.
Another simple indicator of population reproduction is the vitality index. The vitality index I V, unlike natural growth, is not a difference, but the ratio of the number of births B to the number of dead D, multiplied by one hundred for ease of interpretation:
I V= B/ D* 100
Russian historian M.N. Pokrovsky used the vitality index to characterize reproductive processes in Russian Empire over a period of almost a hundred years, starting from the end of the X VIII century. Therefore, in our country, this indicator is also called the Pokrovsky index.
Recently, another indicator has been used, the so-called depopulation coefficient. It is the ratio of the number of deaths to the number of births. If this coefficient exceeds one, it means that in the country, as in present-day Russia depopulation occurs.
Both indicators of natural increase and the vitality index measure the rate of "natural movement" of the population and are general characteristics replacement generations. If, over a certain period of time, the number of births exceeds the number of deaths, then it can be assumed that older generations are replaced by more numerous generations of children and grandchildren. Otherwise, older generations probably do not reproduce themselves quantitatively.
The coefficient of natural increase, like other general demographic indicators, is influenced by numerous structural factors, the main of which is the age composition of the population. Thus, the young population will have a higher natural increase compared to the population in which the same age characteristics of mortality and fertility are observed, but the proportion of older age groups is higher.
The most adequate quantitative characteristics of reproduction are indicators that most directly reflect the process of generational change and do not depend on the age structure of the population. The most obvious way to measure the rate of generation replacement is a direct comparison of the number of generations of mothers and their daughters, fathers and sons, parents and their children at an age that is approximately equal to the average age of parents (father, mother) at the birth of children. Usually, population reproduction rates are calculated not for real, but for hypothetical (conditional) generations. In the latter case, to calculate reproduction rates, it is sufficient to collect data on age-specific birth and death rates for any calendar period eg one year. To assess the replacement rate of real generations, it is necessary to have relevant information for a period covering the life of generations over 50 years - from the time of their birth to the moment when all representatives of each generation leave the reproductive ages.
There are two more indicators of generational replacement: gross and net reproduction rates. They were introduced into scientific circulation by the German demographer R. Kuchinsky. The net reproduction rate was developed by Kuchinsky's teacher, the famous German statistician R. Beck in 1884. However, contemporaries could not appreciate the significance of this indicator. Robert Kuchinsky owes demography to the appearance in 1907 at the Fourteenth International Congress on Social Hygiene and Demography (Berlin) of the total birth rate and, somewhat later, the gross reproduction rate. However, the full mathematical substantiation of these indicators was given by A. Lotka within the framework of the theory of a stable population.
Gross reproduction rate (accepted designationsR or GRR) can be considered as a special case of the total fertility rate. Gross coefficient calculations are performed according to the approximate formula:
Where:
d - proportion of girls among newborns. As a rule, it is taken equal to» 0.488 and the same for all ages of women. So, if the total fertility rate in Russia for 2000 was 1.214, then the gross reproduction rate was equal toR » 0,488 ´ 1.214 = 0.592. Recall that the total fertility rate is equal to the sum of the age coefficients.
However, there is a significant difference in the interpretation of these two indicators. The total fertility rate is the number of births of children of both sexes that a woman can have while maintaining the observed levels of age-specific fertility. The gross reproduction rate for a conditional generation is the average number of girls that one woman can give birth to, if she survives to the end of the reproductive period and maintains current fertility levels at each age throughout it. As an indicator of generational replacement, the gross coefficient has one significant drawback. In fact, when calculating it, the assumption is made that all daughters survive until the end of the reproductive period. Thus, the gross coefficient is an extreme case of generational replacement. This shortcoming is eliminated in the net reproduction rate.
In terms of generational replacement net reproduction rate (accepted designations R0 or NRR ) is the average number of girls born in a lifetime to one woman who survived to the end of her reproductive years at given birth and death rates. With the availability of relevant information, net and gross ratios can also be estimated for the male population. In fact, the net coefficient measures the rate at which the parent generation is replaced by the child generation. CalculationsR0are performed according to the formula: , where
F x is the age-specific fertility rate at the age X,
L x- average number of living women aged X according to the mortality table;
l 0 =100000 is the radix of the mortality table.
Table 8.1. an algorithm for calculating the net coefficient is presented on the example of the female population of Russia in 2000.
Table 8.1.
Calculation of the coefficients of reproduction of the population of Russia for the year 2000.
|
Age groups |
Age-specific fertility rates F x |
fx= d*Fx |
L x/ l 0 |
d * F x* L x / l 0 |
|
0,0137 |
||||
|
0,0465 |
||||
|
0,0335 |
||||
|
0,0360 |
0,0176 |
|||
|
0,0120 |
0,0059 |
|||
|
0,0012 |
||||
|
0,0000 |
||||
|
Sum |
0,2426 |
0,1184 |
R 0 \u003d 0.5 73 |
|
|
Amount*5 |
Fsum =1.213 |
R= 0.59 2 |
Since the net coefficient includes a combination of birth and death rates, it is used as an integral generalizing characteristic of population reproduction. However, one often encounters an incorrect interpretation of this indicator. The net reproduction rate calculated for a hypothetical generation as a measure of the replacement of the maternal generation by the child makes sense only within the framework of a stable population model. This population is increasing (or decreasing) asR 0 once in a while Tequal to the average generation length. Under the average generation length T, as noted before, understand the average time interval separating the generations of parents and their children (mothers and daughters, fathers and sons). For an approximate estimate T in practice, the average age of the mother at birth is used.So, in 2000, the net reproduction rate in Russian Federation was equal to 0.57. This does not mean that the country's population will decrease by 43% in 25-30 years (approximate generation length in Russia). Such a statement is true only for a stable population, which the population of Russia is not.
The dynamics of the gross reproduction rate fully corresponds to the dynamics of the total birth rate. The value of the net coefficient before the beginning of the demographic transition was subject to significant fluctuations, reflecting the catastrophic changes in the level of mortality caused by epidemics, wars, famines, and natural disasters. The average level around which these fluctuations occurred over a long historical period remained fairly stable and was slightly above the level of simple reproduction. With the beginning of the demographic transition, the net ratio increased, which was due to a significant decrease in mortality. Even at the end of the twentieth century In some developing countries, mainly Arab, (Saudi Arabia, Oman, Jordan, Yemen, etc.), its value exceeds 2.5. As the demographic transition is completed, the value of the net coefficient tends to 1. In almost all European countries, including Russia, its value is less than one.
Figure 8.1. shows the change in the levels of gross and net reproduction rates for the female population in a hypothetical country over a period of almost 120 years. According to its historical characteristics, this country is closer to the states of Western Europe. The total birth rate at the first stages of the demographic transition increased from 5.5 to 6.3, and then decreased to 2. The age-specific features of mortality correspond to the West family of standard mortality tables. At the same time, life expectancy has gradually increased from 25 to 80 years. The dynamics of the gross rate repeats the changes in the total fertility rate, adjusted for the proportion of girls among newborns. It increased from 2.6 to 3.1 and then decreased to 0.98 female births per woman. At the same time, the net reproduction rate at the first stage of the demographic transition increases from 1.06 to 1.73, and then decreases to 0.97.
Figure 8.1 Model estimates of gross and net reproduction rates throughout the demographic transition.

In a similar direction, taking into account all the fluctuations caused by the terrible cataclysms of the 20th century, there was a change in the gross and net coefficients in Russia (see Table 8.2). The net coefficient reached its maximum values in the mid-20s. last century. Then his level began to decrease. Already since the mid-1960s. the net reproduction rate was less than 1, while the values of the natural increase coefficient were positive. This means that the regime established in Russia four decades ago demographic reproduction, did not provide quantitative replacement of generations.
Table 8.2.
Coefficients and the price of simple reproduction of the population of the Russian Federation.
|
years |
Gross reproduction rate |
Net reproduction rate |
The price of "simple" Reproduction |
|
1894-1903 |
3,244 |
1,636 |
1,98 |
|
1927 |
3,282 |
1,681 |
1,95 |
|
1939 |
2,394 |
1,367 |
1,75 |
|
1958-1959 |
1,276 |
1,186 |
1,08 |
|
1964-1965 |
1,044 |
0,971 |
1,08 |
|
1969-1970 |
0,972 |
0,934 |
1,04 |
|
1974-1975 |
0,973 |
0,932 |
1,04 |
|
1979-1980 |
0,911 |
0,874 |
1,04 |
|
1986-1987 |
1,071 |
1,038 |
1,03 |
|
1989 |
0,983 |
0,953 |
1,03 |
|
1995 |
0,656 |
0,633 |
1,04 |
|
2000 |
0,592 |
0,571 |
1,04 |
A temporary increase in the birth rate as a result of the demographic policy of the 1980s led to a certain increase in the net reproduction rate, the values of which in 1987-1988. exceeded 1. However, in the subsequent period, its value fell to a level below 0.6.
The positive population growth lasted until the early 1990s, thanks to migration and the growth potential accumulated in the age structure. In a population with a significant proportion of people of reproductive age, even at a birth rate that does not ensure simple reproduction, the number of births at a certain stage will exceed the number of deaths. However, the growth potential inherent in the young age structure will soon be exhausted. Under conditions of low birth rates and a progressive aging process, positive values of natural increase are gradually replaced by negative values.
Gross and net coefficients calculated for hypothetical generations have all the disadvantages inherent in all indicators of cross-sectional analysis. They can distort the real course of demographic development, their dynamics is subject to the influence of market factors. As is known, these shortcomings are overcome with the help of longitudinal analysis methods. Therefore, back in the 40s. the French demographer P. Depois proposed to estimate the reproduction rates for real generations. He was the first to perform such calculations for the population of France for the entire X 10th century.
There are several methods for estimating the net reproduction rate of real generations. The most obvious one is to apply the formula

Only now it should use birth and death rates for real generations. Complete and reliable estimates of cohort mortality rates have been made only in a few developed countries, where adequate mortality records have been established for a long time.
The French demographer J.-P.Sardon, based on the corresponding estimates of mortality and birth rates of cohorts, calculated the net reproduction rates for real generations of Western European countries. The results they get are amazing. In Belgium, Sweden, Switzerland, Germany, Italy, Greece, not a single generation born in 1901-1955. did not reproduce itself quantitatively. Only in Iceland and Ireland did the net coefficients of these generations exceed one. In Austria, Great Britain, Denmark, France, the Netherlands, Portugal and Spain, only certain generations born between the first and second world wars, the birth rate ensured an expanded reproduction of the population.
Available calculations show that the net reproduction rate of cohorts born in X I X century, was at the level of 1.4 - 1.5, i.e. each generation gave birth to 1.4 - 1.5 times more children than the generation of its parents. Cohorts 1880-1900 births reproduced themselves with an increase of 10-20% (NRR = 1.1 - 1.2), but compared with previous generations, their contribution to population growth has sharply decreased. The reproductive activity of these cohorts fell on the period of the First World War and subsequent years of crisis. Generations born at the beginning of the 20th century demonstrate a sharp drop in the net reproduction rate with the achievement of a level of 0.65 - 0.7 for generations born in 1915-1920. A similar result of reproductive activity is noted for the generations of the 1920s and 1930s. birth. Only in a few generations born after the war, there was a slightly expanded reproduction.
| | |
2. Population reproduction indicators: total fertility rate, gross reproduction rate, net reproduction rate
To get a real idea of the nature of population reproduction, indicators are needed that do not depend on the age and sex structure. In the early 1930s German demographer, economist, statistician R. Kuchinsky (1876-1947) and domestic scientist, demographer, public health organizer G.A. Batkis (1895-1960) used indicators that give a clear picture of the state of the population of the new and old generations in the years adjacent to the years of the population censuses, helping to determine to what extent the living population has prepared a replacement for itself:
total fertility rate;
Gross reproduction rate;
Net reproduction rate.
The total fertility rate shows the number of children born on average to one woman during the entire fertile period of her life (i.e. from 15 to 49 years inclusive). It is calculated like this:
where n x is the age-specific fertility rate for women aged x years.
The calculation can also be performed for five-year intervals:
and for 10 year olds:
An example of calculating the total fertility rate is given in Table. one.
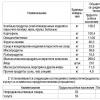
Table 1. Calculation of the total fertility rate for the rural population Novosibirsk region, 1999
| Mother's age, years | Age-specific birth rate on average per year, % | "Expected" number of children for the entire age interval |
As follows from Table. 1, for the entire fertile period, each 1000 rural women of the Novosibirsk region will give birth to 1404 (1403.5) children, i.e. 1,414 on average per woman, or a rounded figure of 140 children per 100 women.
The total fertility rate as an indicator of population reproduction is not without drawbacks. So, he does not take into account: firstly, that the reproduction of a new generation can be characterized by the number of girls that each woman leaves behind; secondly, that some children die before reaching the age of the mother at the time of their birth, leaving no offspring behind, or leaving a smaller number of children compared to their peers who successfully survived until the end of the childbearing period.
The first drawback can be eliminated using the gross reproduction rate R b calculated by the formula
where d is the proportion of girls among those born.
For the example given in Table. 1, and at d - 0.488
R b \u003d 1.4035 0.488 \u003d 0.6849.
Therefore, every 1000 women leave behind 685 girls (684.9), i.e. in rural population area is not carried out even a simple reproduction.
The advantage of the gross coefficient is that its value is not affected by the composition of the population by sex and that it takes into account the age composition of women of childbearing age. However, it does not take into account the mortality of women of childbearing age.
For the most accurate characterization of population reproduction, the net coefficient is used. In the statistical literature, it is called pure or purified. It shows the number of girls that each woman leaves behind on average, taking into account the fact that some of them will not live to see their mother's age at the time of their birth.
However, if each of their women of reproductive age gives birth to an average of R daughters, this does not mean that the number of daughter generations will be R times larger or smaller than the number of mothers. After all, not all of these daughters will live to the age at which their mothers were at the time of birth. And not all daughters will make it to the end of their reproductive years. This is especially true in countries with high mortality, where up to half of newborn girls may not survive until the start of the reproductive period, as was the case, for example, in Russia before the First World War. In our time, of course, this is no longer the case (in 2004, more than 98% of newborn girls survived to the start of the reproductive period), but in any case, an indicator that also takes into account mortality is needed. Given the assumption of zero mortality until the end of the reproductive period, the gross reproduction rate of the population has hardly been published or used recently. An indicator that also takes into account mortality is the net reproduction rate of the population, or otherwise the Böka-Kuchinsky coefficient, proposed by the German statistician and demographer G.F.R. Byok. Otherwise, it is called the net reproduction rate of the population. It is equal to the average number of girls born in a woman's lifetime and surviving to the end of the reproductive period, given birth and death rates.
To calculate the net coefficient Rn, apply the following formulas:
a) for one-year age groups:
![]() ,
,
where n x - age coefficients for women of age group X years; d - the proportion of girls among those born;
Average number of living women in the stationary population of life tables in the age range from X to X+ 1;
b) for five-year age groups:
R b = ![]()
where - age-specific fertility rates for women in the age group from X to X + 4;
Average number of living women from life tables in the age range from X to X+4 (+ +1 + +2 + +3 + +4);
c) for ten-year age groups:
R b = ![]() ,
,
where - age-specific fertility rates for women in the age group from X to X + 9;
Average number of living women in the stationary population of survivors in the age range from x to x + 9.
Example. The number of women in the stationary population of the Novosibirsk region is known (according to the survival tables) and the age-specific fertility rates:
Let's calculate the net reproduction rate. Let's define the "expected" number of children.
| Age group (years) | |
| 44,3487400:1000=21592 121,5484863:1000=58911 71,7481410:1000=34517 28,8477476:1000=13751 11,1472404:1000=5244 3,2465094:1000=1488 0,1454729:1000=46 |
With the proportion of girls among births d = 0.488 Rn = 135 5490.488:
100,000 = 0.66148, or rounded up to 0.662.
Consequently, every 1,000 rural women leave behind only 662 girls. The initial conclusion is confirmed, which states that a regime of narrowed reproduction has been established in this population.
The advantage of the net coefficient is that it takes into account the birth rate in certain age groups of women at the time of compiling survival tables, and when calculating it, the mortality rate of the population, the probability of surviving to the next age group are taken into account. In statistical practice, the following scale for estimating the net reproduction rate is adopted: at Rn = 1.0, simple reproduction occurs; with Rn > 1.0 - extended, with Rn< 1,0 - суженное.
B.S. Yastremsky established the relationship between the total birth rate, fertility rate (special birth rate, fertility rate) and population reproduction rates (Tables 2 and 3).
Table 2. Relationship between fertility rates
Table 3. Relationship between fertility and population reproduction rates
Therefore, the boundary between narrowed and simple reproduction lies between the meanings:
· special coefficient birth rate from 100 to 150 ‰;
· gross reproduction rate from 0.86 to 1.29 ‰;
· total fertility rate from 15 to 22 ‰.
The net reproduction rate can be calculated not only for the female, but also for the male population using the same method. In this case, it shows how many boys each man leaves behind, taking into account the fact that some of them will not live up to the father's age at the time of their birth.
To calculate the net reproduction rate of the male population for one-year groups, the formula can be used:
 ,
,
where - age coefficients of birth of children in families in men of the age group x years,
Number of living males in the stationary population of life tables in the age range from X years to X + 1;
d M is the proportion of boys among those born.
Similarly, the calculation is carried out for five- and ten-year age groups.
Table 4. Initial data for calculating the reproduction rates of the male and female population of the region, people
Note. Age groups: for women - 15-49 years old, for men - 18-55 years old.
Calculate the number of births per 1000 population (n x) as (N x:S x 1000).
| Age group | Women | Men |
| 45 and older Average |
Hence the total fertility rate according to the formula:
51000 for women:
=(78,3 + 226,7 + 193,2 + 106,2 + 36,3 + 8,9 + 1,6)5:1000 = 3,26;
for men:
+ (23,0 + 234,3 + 231,2 + 146,6 + 68,3 + 18,2 + 5,7)5:1000 = 3,64,
those. each woman for the entire fertile period of her life leaves an average of 3.26 children, a man - 3.64.
The gross reproduction rate of the population is calculated by the formula R b = :
3,260,488 = 1,591;
3,640,512 = 1,864,
those. each woman left behind an average of 1,591 girls, a man - 1,864 boys.
To proceed to the definition of the net ratio, we calculate the "expected" number of children: : 1000, for example,
for women: 78.3485 117: 1000 = 37 985;
for men: 23.0487 370: 1000 = 11210 etc.
Net reproduction rate:
formula for women
R b = ![]() ):
): ![]() ;
;
for men formula
): ![]() .
.
Consequently, every 1000 women leave behind on average 1529 girls, taking into account the fact that some of them will not live up to the age of the mother at the time of their birth, and every 1000 men - 1724 boys, provided that part of them will not live to the age of the father at the time of their birth. birth. The net coefficient of the male population is higher than the net coefficient of the female population by 0.196 points, or 12.8%.
In the second half of the XX century. In the world, there was a downward trend in all three indicators of population reproduction, and for economically developed countries it crossed the boundaries of simple reproduction (Fig. 1).

Rice. 1. Net coefficient curve for 1960-2006
The first turning point in Russia's recent demographic history was 1964, when the fall in the net reproduction rate of Russia's population crossed the generational replacement line. That same year, the mortality curve began to creep up, which, in the end, led to the modern shameful level of life expectancy for Russians.
Period X is a characteristic resonant surge caused by the politics and conjuncture of the 80s: a slow, jerky rise, a slight upper plateau and an accelerating collapse far below the point of initial growth. It is noteworthy that the collapse of the population reproduction rate began long before the "criminal liberal government" came to power and the sharp deterioration in the socio-economic situation of the Soviet people.
The Y-period is divided into two political eras: the Yeltsin era, when uncertainty grew and the socio-economic situation of the majority of the country's population worsened; and Putin's era - when certainty grew, the vertical of power strengthened, the socio-economic situation improved, the optimism of the voting majority multiplied.
The graph clearly shows the growth of the curve since the 1999 post-default year: there are still 8 years of pre-active demographic policy.
According to UN forecasts, by the period 2010-2014. regions with narrowed population reproduction will include Foreign Europe, Overseas Asia, Australia and Oceania. The highest level of the net ratio will remain in Africa. And America 109 women will leave behind 109 girls.
In Russia, the process of narrowed reproduction is deepening (see Table 5.)
Table 5. Dynamics of the net reproduction rate of the population in the Russian Federation in 1960 - 2000
The narrowed reproduction of the urban population began by the end of the 1950s, rural - since 1993.
In 2000, every 1,000 women of childbearing age left 529 girls in cities, countryside - 704.
According to the "Demographic Yearbook", the total fertility rate for the period from 1991 to 2000 fluctuated in the CIS countries from 1.10 in Ukraine to 4.09 in Turkmenistan. In Europe, in 1999, the Czech Republic had the lowest level of the indicator - 1.12, the highest France - 1.77. In Asia for 1995-2000. most high level reached Iran - 5.30 and Saudi Arabia - 5.80, the lowest - Japan - 1.39; China had 1.80, India 3.40. In Africa, the total fertility rate reached 3.81 in Algeria, 3.74 in Egypt, and 3.25 in South Africa (1995-2000). In America for 1995-2000. Canada had the lowest level of the indicator - 1.64, the highest - Mexico - 2.75; in the USA -2.02; in Australia - 1.80 (1996), in New Zealand - 1.97 (1997).


Over the reproduction of the population develops in parallel with the expansion of the boundaries of growth in the number of human populations as a result of production activities of people. But mankind takes the first steps on the historical path with this type of population reproduction, which is formed "between two worlds": the goals of demographic regulation are set by nature, the means are given by society. This original...
Over a long period of time allows us to conclude that as a result of changes in the course of socio-economic development and under the influence of demographic policy, there has been a transition to a new type of population reproduction with low demographic indicators, which makes it possible to ease the pressure of the population on the productive forces and the natural environment and reduces demographic pressure...