From time to time, every forex trader needs to study in detail own results trade. Unfortunately, the standard functionality of MetaTrader4 only allows you to build a generalized statement, the information of which is not enough for an objective assessment of profits/losses, so programmers have created a special Equity indicator.
First of all, let's figure out how this indicator is superior to a regular report, the document of which can be saved in several formats:
- It builds balance and equity charts in real time, i.e. information is updated automatically.
- In an ordinary statement, the results are grouped immediately by the set of operations, i.e. the equity line represents the balance of all transactions, and the Equity indicator allows you to explore the dynamics of the account in the context of tickers, which significantly increases the information content of the report.
- With this simple Expert Advisor, you can split trading results separately into buys and sells, which is impossible to achieve with the built-in MT4 functions.
The Equity v.7 indicator in Meta Trader 4 is installed in the standard way, like many others, and you can download it here:
Setting the Equity indicator
Despite the fact that this Expert Advisor is not designed to analyze the current market situation, it is set according to the standard scheme, i.e. is first copied to the appropriate directory of the terminal, after which it is attached to the price chart.
Here I would like to note that it is better to immediately attach the Equity algorithm to the asset, financial results which will be of the greatest interest, since in this case it will take less time to set up.
So the first function in the list of variables is called Only_Trade . If the value "false" is set here, the EA will display the dynamics of the balance "as is", i.e. in addition to the result of transactions, it will show all deposit replenishment and withdrawal facts.
The next variable "Only_Current" is intended for setting the Expert Advisor in such a way that it shows profit/loss strictly for the asset on the chart of which it is set.
Above, I have already focused on such nuances when I recommended attaching Equity v.7 to the asset with the most transactions.

If there is an urgent need to study the results of trading a certain asset in the window of another instrument (for example, the Equity indicator is set on the EURUSD pair, and we need to calculate the profits and losses received from oil transactions), you will need to perform the following actions:
- Opposite the Only_Current function, select "false"
- In the Only_Symbols field, manually enter the ticker of the instrument that we will analyze.

The following two functions (Only_Buys and Only_Sells ) allow you to evaluate profits and losses in terms of purchases and sales, in particular, the following combinations are possible here:
- If both variables are set to "false", the EA will draw a common Equity line;
- If Only_Buys = true and Only_Sells = false, the fixed result will be shown only for long positions;
- If Only_Buys = false and Only_Sells = true, the EA will display profits/losses from sales;
- If Only_Buys = true and Only_Sells = true, the indicator will work erroneously, so similar situation should be avoided.

From the above example, you can see that the main income was received mainly from short positions(i.e. according to the trend in time with the price movement). Therefore, it is advisable to supplement the system with auxiliary tools, with the help of which the accuracy in assessing the trend will increase.
The following Show_Balance function is intended to enable/disable the balance line. For example, if the value "false" is set opposite this variable, the labeling of the Equity indicator will look like this.

As for the Show_Margin and Show_Free variables, they are buggy, so trying to adjust them is a waste of time. Initially, the mentioned variables were intended to display margin and free equity.
And the last switch function is called Show_Info . As you can already guess, it is used to display an information board, which collects information about the maximum and absolute drawdowns.
Besides, in Equity algorithm settings you can set the level of drawdown, after reaching which, the terminal will emit a sound signal.

This function is unnecessary for medium-term and long-term traders, since with such a style of work, the account changes smoothly and slowly (there is time to track the dynamics). For aggressive scalpers and algorithmic traders (trading with the help of robots), the mentioned variable can be useful.
Thus, the Equity indicator not only visually shows the results of trading, it also helps to identify strong and weak sides system in use.
The modern Forex currency market opens up a lot of prospects for traders, allowing them to earn a decent fortune. However, due to inexperience, newcomers who enter the market with great ambitions enchantingly drain their deposits and move away from currency trading, loudly scolding Forex and calling it a scam. Many of them in their trading practice do not even use indicators that allow them to quite successfully analyze a currency pair and make an accurate forecast. We offer indicatorMitBbalance, which, if used correctly, can significantly increase your deposit and bring profit in 9 out of 10 transactions. In this article, we will consider the indicator itself, as well as get acquainted with the rules of trading on its signals in practice.
Watch the video review of the Mit balance indicator
Description of the indicator
Mit Balance was written for the MetaTraider 4 terminal used by many traders. The archive, in addition to the indicator in .ex4 format, contains two text files with information on its use.
The Mit Balance indicator analyzes the market, highlighting the levels that the price tends to during the trading period. Additionally, it calculates the optimal levels for entering the market, using the principles of the Gann theory. The tool is perfect both for an intraday strategy (TF from M1) and for opening long-term orders on large timeframes (TF up to H4). The authors recommend using the H1 timeframe for trading.
By installing the indicator in the trading platform according to the standard procedure and applying it to the selected currency instrument, price movement levels are immediately formed (Fig. 1). In order not to take risks and not immediately open deals, it is recommended to get acquainted with the history of signals from the indicator (as a rule, they will also be displayed on the chart). Only after studying in detail the principle of operation of the indicator, it will be possible to proceed to the subsequent profitable trading based on careful price analysis.
Setting the Mit Balance indicator
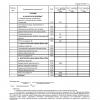
The correctness of the generated signals will be achieved only when the correct values are set for the parameters (Fig. 2):
- History - the number of bars used in the analysis;
- Percentage of TP shift - used in a comprehensive analysis using other indicators from the MIT System;
- Opening time of a daily candle - indicates the start time of quoting the analyzed financial instrument;
- Extend level – whether to display the balance level until the moment when it is reached by the price (ON – yes, OFF – no);
- Show entry levels – whether to calculate preferred entry levels and channel boundaries (ON – yes, OFF – no);
- Statistics offset – the number of pixels to indent the display of statistical data from the top border of the window;
- The options in the Colors category determine the coloring of levels, zones, and text.

Trading on the Mit Balance indicator
A trading instrument that takes into account all price movements within the day, as well as past growth and fall dynamics. At the same time, zones of local minima and maxima are also taken into account, and forecasts are formed on the basis of these data. AT certain period, when the most favorable conditions for entering the market arise, the indicator on the chart forms a channel, which is a signal for the trader to open a certain transaction.
When opening short orders on low time frames, it is extremely important to constantly monitor the price movement, as the channel can close very quickly, and the price reverses and moves in the opposite direction. Most often, such sharp fluctuations does not occur on large timeframes, as a result, the indicator is much better suited for the H1 and H4 time periods. It is advisable to additionally use a tool that allows you to identify the trend.
Each trading day, at the time specified in the Daily Candle Opening Time parameter, the indicator calculates the levels of balance and optimal market entries. The trader places pending orders of the Limit type at the optimal entry levels, and Take-Profit at the balance level. At the end of the day, all failed orders (the price has not reached them) are deleted. They also become irrelevant when the price reaches the balance level (take profit is allowed only once).
For inexperienced traders, such a tool will allow you to make good money, since all the analysis will be done by the indicator itself. You just need to carefully monitor the upcoming appearance of the signal.
But do not forget that not all signals work out perfectly, sometimes there are extraneous noises that can be filtered out using auxiliary indicators, such as Elliot Waves or Bollinger Bands. Also, the indicator can be used in conjunction with moving averages. In this arrangement, the number losing trades will be reduced to a minimum.
On Balance Volume (OBV) indicator- a simple classic oscillator that displays price fluctuations based on changes in market volume over a certain period of time.
Principle cumulative volume, on the basis of which the instrument is built, was first introduced in 1946, but it gained wide popularity only in 1963, after the publication of the book D. Granville « New strategy the most profitable day trading in the stock market».
Description of OBV
The impetus for the creation of the OBV indicator was the theory that a major change in volume always precedes a strong price move. The market does not have to react immediately.
For example, in situations where the most big players, owning certain information, begin to invest in assets that most of the other participants are trying to get rid of.
That is, the volume has already increased significantly, but the price movement vector has been directed downwards for some time by inertia. When a critical mass accumulates, the trend reverses sharply and becomes up. Small and medium investors, of course, immediately join it and make it even stronger. When large players decide to dispose of their assets in this way, a mirror situation arises.
Settings On Balance Volume
The Balance Volume Indicator is included in the basic package of most popular platforms, including . To configure it, you need to set only three main parameters:
- « Apply to» - here you set the price on the basis of which the curve will be built. high and low– bar maximum and minimum, close and open– closing and opening of the bar, etc.
- « Fix min/max» – for setting the lower and upper levels of the indicator.
- « Style» – choose how the curve will look on the chart.

Independently calculate the value of the indicator OBV not required, however general development let's see how this is done, especially since the formula is not too complicated. If the closing price is higher than previous period, its volume is added to the indicator value. If the price is less than its predecessor, then the volume of the current bar is subtracted. In this case, the result will be negative. When prices are identical, a straight line is displayed on the chart.
When calculating for Forex market tick volume indicators are applied.
The main disadvantage here is that the deal is equal to one tick, regardless of its value. Roughly speaking, buying/selling a million is equal to buying/selling a dollar. Of course, such leveling does not contribute to an objective assessment, but it must be taken for granted. That is why the indicator should be used only on daily, weekly and other long timeframes. There, the values of the volumes are balanced. It should be noted that when analyzing OBV, as a rule, for numerical values special attention do not pay. The trader is guided solely by the behavior of the curve.
Signals or how to use the OBV indicator
The indicator can be used:
- to confirm the current trend;
- to receive divergence and trend reversal signals;
When each new high / low of the price chart coincides with the corresponding extreme of the indicator, then we can talk about the presence of a stable up / down trend.
If the vector is directed upwards, you can open a deal to buy, if downwards - to sell.
Naturally, trend confirmation is not a signal for a trade deal, but simply useful information to contemplation. In the flat state, the indicator does not go beyond the boundaries of a certain horizontal corridor for a long time and does not form successive peaks/troughs. There are no strong trends in the market during this period.
In cases where the OBV curve does not keep up with the price action, there is a “no confirmation” or divergence.
It is observed either at the top bull market, or at the bottom of a bearish one. In the first case, the chart reacts to the next price increase with a slight decrease. If the situation repeats at the next high, then the price movement is inertial and a reversal or correction will take place soon. This is a sign that you need to look for a moment to open sell positions.

If price and curve OBV synchronously update minimum after minimum, but at some point the latter starts to grow a little, it forms bullish divergence. This is the optimal time to open a buy trade. The downward movement continues by inertia, and soon the price will start to rise. Open positions are closed immediately after the vector change is confirmed by other technical analysis tools.
Divergence is the only, truly significant, independent signal of On Balance Volume, so you should treat it with due attention.
Often, indicator users draw levels on the chart overbought / oversold. The intersection of any of these lines can mean an early trend reversal. If the upper level is broken from below, a sell position is opened. If the lower limit is crossed from above, a buy deal is formed. At the same time, there is always a risk that the trend will be too strong, and the price will continue to move in the same direction.
Video - trading with the OBV indicator
Conclusion
Indicator OBV not recommended for short periods. Even on hourly timeframes, strong distortions appear, depriving the work of special practical meaning. We already talked about the reason for their occurrence above - a high probability of a serious discrepancy in the indicators of "money" and "tick" volumes.
As an independent analysis tool, OBV is rarely used.
It is usually used as a confirming indicator to determine the trend vector. The ideas on which the tool is based have long been used in many other, more complex and efficient programs. These include, for example, indexes cash flow and , and others.
If you find an error, please highlight a piece of text and click Ctrl+Enter.
Introduction
The Forex / Forex market is a highly profitable and high-risk means of making profit from transactions on exchange rates. The tools used in the Forex market largely determine the result of currency trading by Forex market participants who are clients of brokers. Each Forex Broker offers his trading terminal, however, most Forex brokers and traders today agree on their choice MetaTrader terminals 4 and MetaTrader 5. The ForexMoney forum was created for those who choose the MetaTrader family terminal, as well as binary options broker platforms in their Forex trading.
Trade discussion
Forex market forecasts, independent expert opinions foreign exchange market- you will find all this in . Forex experience is welcome, but entry and the right to participate in discussions are not prohibited for everyone, including novice traders. Exchange of opinions on currency movements, demonstration of one's own trading, keeping trader's diaries, development of Forex strategies, mutual assistance is the main goal of communication in the Forex trading forum.
Communication with brokers and traders (about brokers)
If you have a negative or positive experience with a Forex broker, share it in a forum dedicated to the quality of brokerage services. You can leave a review about your broker, talking about the advantages or disadvantages of trading through it. The totality of traders' reviews about brokers is a kind of rating of Forex brokers. In this rating, you can see the leaders and outsiders of the Forex trading services market.
Software for traders, trade automation
We invite traders involved in trading automation, creating Forex robots to the section where you can ask any question about trading platforms MetaTrader, publish your developments, or take ready-made recommendations for automating trading.
Free communication on the ForexMoney Forum
Do you want to relax? Or do you not yet have the necessary qualifications to communicate in the trading sections? Then a Forex forum for. Of course, communication on topics related to the Forex market is not prohibited. Here you will find jokes about traders, cartoons on economic topics and a full-fledged off-top.
Money for communication on the ForexMoney Forum
The ForexMoney forum allows you to get not only the pleasure of communication, but also a significant financial reward thanks to. Funds accrued for messages that develop the forum and arouse the interest of the forum audience can be used in Forex trading with one of the forum partners.
Thank you for choosing our forum as a place of communication!
Platform: MetaTrader 4
Year: 2015
Manufacturer: ARGOlab
License type: Freeware / Donateware
Timeframe: any
ArgoGuardian is a free auxiliary advisor, the main purpose of which is to control open profit/drawdown on the account. When the desired profit or the maximum allowable drawdown is reached, the adviser closes all orders or sets a full lock (lock), deletes pending orders and stops, notifying the user with an e-mail message.
Optionally, after stopping, the adviser can release the autotrade button in the terminal so that other advisers can no longer open deals (mode AutotradeOFF=TRUE). Optionally, the EA can close all charts of the terminal except for its own, so that other EAs do not get under their feet and do not take it into their heads to open new orders while ArgoGuardian closes orders (mode CloseCharts=TRUE).
The EA can also send a warning to e-mail about a dangerous drawdown on the account (the drawdown value is set by the variables MaxDD_Email, MaxDDPerCent_Email, MaxDDEquity_Email). An important feature of ArgoGuardian is the flexible setting of orders that it "grazes", i.e. takes into account when calculating profit / drawdown and, accordingly, closes / locks. With default settings ( Symbols = All, Magic = -1), the EA takes into account all open orders on the account. If you set the mode Symbols = ThisSymbol, then the EA will take into account orders only for the currency pair, on the chart of which the EA is attached. If you set the mode Symbols = MaxDDSymbol, then the EA takes into account orders only for the symbol with the maximum drawdown. Additional filtering can be done using the Magic variable. If Magic >=0 is set, then the EA only considers orders with this magic. By combining these two filters, you can selectively monitor drawdowns for different instruments and for different Expert Advisors on the account.
It is possible to use two (or more) copies of ArgoGuardian with different settings on one account. For example, one copy of ArgoGuardian will track the maximum drawdown for one instrument (Symbols = MaxDDSymbol) and another copy will keep track of the maximum drawdown on the entire account (Symbols = All).
The advantage of the adviser is also the flexible setting of the desired take profit and stop loss (= maximum allowable drawdown). You can specify take profit and stop loss in units of the deposit currency ( TProfit, MaxDD). And you can - as a percentage of the deposit balance ( TProfitPerCent, MaxDDPerCent). Finally, you can explicitly enter the desired equity value at which profit/loss will be fixed ( TProfitEquity, MaxDDEquity).
Settings:

Chapter logic
Sets which characters ( currency pairs) and magics to take into account and how to fix profit / loss.
Symbols(All/ThisSymbol/MaxDDSymbol) – filter, orders for which symbols to take into account. If Symbols = All, we take into account all symbols; if Symbols = ThisSymbol, we take into account orders only for the symbol, on the chart of which the Expert Advisor is attached; if Symbols = MaxDDSymbol, we take into account orders only for the symbol with the maximum drawdown.
Magic– filter, orders with which magics to take into account. If a< 0 (по умолчанию), учитываем все магики. Если >=0, then we take into account only orders with this magic.
UseLock(TRUE/FALSE) – if FALSE, then profit/loss is fixed by closing orders; if TRUE, then setting a lock (lock).
AutotradeOFF(TRUE/FALSE) – If TRUE, after fixing the profit/loss, the autotrade button in the terminal will be released.
CloseCharts(TRUE/FALSE) – If TRUE, all charts for active symbols, except for the current one, will be closed before taking profit/loss.
Chapter target profit
Sets the take profit, upon reaching which the profit will be fixed.
TProfit - take profit in units of the deposit currency, if 0 then disabled.
TProfitPerCent - take profit in % of the deposit, if 0 then disabled.
TProfitEquity – an explicit value of equity (equity), upon reaching which profit will be fixed, if 0 then disabled.
SendEmailOnTP (TRUE/FALSE) – send an email notification when a take profit is fixed.
Chapter stop Loss
Sets the stop loss value, upon reaching which the loss will be fixed.
MaxDD - maximum open drawdown in the deposit currency, if 0 then disabled.
MaxDDPerCent - maximum open drawdown in % of the deposit, if 0 then disabled.
MaxDDEquity – an explicit value of equity (equity), upon reaching which the loss will be fixed, if 0 it is disabled.
SendEmailOnSL (TRUE/FALSE) – send an email notification when a loss is recorded.
Chapter Email notification
Sets the value of the open drawdown, at which a warning message will be sent to the email.
MaxDD_Email – open drawdown value in the deposit currency, if 0 then disabled.
MaxDDPerCent_Email – open drawdown value in % of the deposit, if 0 then disabled.
MaxDDEquity_Email – Explicit value of funds (equity), if 0 then disabled.
For these options to work, .