Age is the period from the birth of a person to a particular moment of his life.
The most important division of people by age into three categories:
1. Under 16 years old - 22.4%
2. 16-65 (able-bodied) - 64.6%
3. Over 65 years old (above working age) - 13%. According to territorial differences, the younger (in terms of population composition) is Far East, the oldest - the Central Black Earth region.
Age structure population plays important role in demographic processes, influencing the value of all demographic indicators. Thus, with a relatively high percentage of young people in the population, there will be high level nuptiality and fertility, and a low mortality rate (because, quite naturally, young people are less likely to get sick and even less likely to die). In turn, demographic processes have a strong influence on the age structure of the population.
The age structure plays an active role not only in demographic, but in all social processes. Age is associated with psychology, emotionality, to some extent - the human mind. Revolts and revolutions occur more often in societies with a young age structure. On the contrary, aging societies, with a high proportion of the elderly and the elderly, are prone to dogmatism and stagnation.
Information about the age of individual groups of people at the time of observation makes it possible to build the age structure of the population.
To build the age structure of the population, one-year and five-year age intervals are usually used. Much less often, the age structure is built on ten-year age intervals.
The five-year age structure is based on the following age groups: 0 years old, 1-4 years old, 5-9 years old, 10-14 years old, ..., 35-39 years old, ..., 80-84 years old, ..., 100 years and older.
This is the so-called standard age grouping, which is used in international demostatistical practice (in particular, in UN publications) and which should be followed by anyone who uses age as an independent or dependent variable. This is necessary to ensure comparability of the results of different studies.
The general trend in the change in the age structure of the population as the birth rate declines and the average life expectancy grows, naturally, there is a trend towards an increase in the proportion of older people, i.e. the process of demographic aging of the population.
Under population aging, or demographic aging, is understood as an increase in the proportion of elderly and old people in the population.
There are two types of population aging:
· bottom aging which is the result of a declining birth rate.
· top aging, which is the result of an increase in the average life expectancy, a decrease in mortality at older ages in conditions of low birth rates.
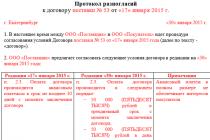
In every society, a fairly stable age structure of the population develops. According to the predominance of certain ages in it, the population is characterized as “young”, “mature” or “aging” (types of age structures according to F. Burgdörfer), see Figure 1:
a) young (growing) population reflects a large proportion of children and a small proportion of the elderly, which creates conditions for population growth - a progressive type of age structure;
b) mature (stationary) population- with a predominance of adult generations and a moderate proportion of other ages. This type shows relative stability, population stability, the possibility of replacing outgoing generations with younger ones. This composition of the population supports its achieved size - a stationary type of the age structure of the population;
c) an aging (decreasing) population- with an increased proportion of older ages compared to children's generations - a regressive type of age structure of the population. This indicates a possible decline in the number of people, in which the younger generations do not make up for the number of those leaving.
a B C)
Population aging has adverse economic and social consequences. First, the proportion of pensioners by age is increasing. On pension funds an exorbitant burden of spending on the payment of pensions is placed, because the proportion of the able-bodied population that makes contributions to these funds is declining.
Secondly, the increase in the proportion of older people poses a challenge for society to organize care for them, especially since the proportion of people over 80 years of age is growing faster than the proportion of older people in general. The process of "aging of the elderly" is especially important for government agencies developing social policy, services designed to help helpless old people.
Thirdly, medical care for the elderly, the need for which naturally increases with aging. Medical service requires additional funds, expansion of the network of medical, gerontological institutions, qualitative restructuring of the healthcare system.
Fourthly, the employment of the elderly population, providing jobs for "young seniors" who want to work (as a rule, people under 70-75 are referred to as "young seniors"). This is a difficult problem as jobs are scarce.
In accordance with three types of age structure, population reproduction modes can be distinguished:
Expanded reproduction - in each next generation there are more people than in the previous one: the population is growing rapidly (typical for most modern developing countries of the world);
simple reproduction - in subsequent generations there are about the same number of people as in previous ones; population, as a rule, almost does not change (typical for some developing and developed countries);
narrowed reproduction - there are fewer people in subsequent generations than in previous ones; the population is declining (typical for most developed European countries, including Russia).
When compared with other countries with low fertility, it turns out that Russia's population is not the oldest. In 1990, it ranked 25th among such countries (a more dramatic position in Japan, Italy, Germany). This is not surprising, since Russia, firstly, is at that stage of the aging process, when the proportion of the middle-aged population practically does not change and aging occurs due to a decrease in the proportion of children, and secondly, due to low life expectancy, not all people live to old age.
Currently, the proportion of people aged 65 years and older in the population of Russia is 13%. According to the UN scale, the population is considered old if the proportion of this age exceeds 7%.
The process of demographic aging of the population is much more characteristic of women, who make up more than two-thirds (68.7%) of Russians.
The average age of the inhabitants of the country is 38.9 years (in 2009 - 38.8 years), men respectively 36.2 years (36.1), women - 41.2 years (41.1). The average age of the population is over 40 years old in 28 subjects Russian Federation, the highest it is in the regions of the European part of Russia: in Tula, Ryazan, Tambov, Voronezh, Pskov, Tver, Penza, years. St. Petersburg and Moscow - 42.2 - 41.1 years.
Every fifth inhabitant of Russia (30.7 million people as of January 1, 2010) is at retirement age. The number of children and adolescents under 16 is 7.9 million people, or 25.6% less than those older than working age. The predominance of older people takes place in 62 subjects of the Russian Federation, the largest: in the Tula region and St. Petersburg - 2 times, Ryazan and Voronezh regions- 1.9 times, Tambov, Leningrad, Ivanovo, Penza, Pskov, Yaroslavl regions, Moscow - 1.8 times.
The population at the age of 0-15 has been declining for 18 years (1990-2007). In 2008, due to the growth in the number of births, the number of births in this age group increased slightly - by 44 thousand, or 0.2%, in 2009 - by 313 thousand, or 1.4%.
The lowest proportion of children aged 0-15 years in the total population is observed in Moscow and St. Petersburg - 13.0-12.9% (in Russia as a whole - 16.1%).
The working-age population, compared with the beginning of 2009, decreased by 0.9 million or 1.0% (in 2008 by 0.4 million or 0.5%) and by the beginning of 2010 amounted to. 88.4 million people. The demographic load indicator increased to 606 people per 1,000 of the working-age population (in 2009 - 590, respectively), incl. load of children - 259 (253), and people retirement age – 347 (337) .
Gender composition of the population
The sex composition of the population is also of great importance, since data on the ratio of men and women in general and at different ages are important for analyzing the process of population reproduction. The main reasons that determine the sex ratio in the world are: the excess of the male population over the female at birth (by 5-6%), and by old age there is a preponderance of women, but by the age of 18-20 the sex ratio is leveling off.
The gender structure of the population is formed under the influence of three main factors:
1) sex ratio among newborns (biological constant);
2) sex differences in mortality;
3) gender differences in the intensity of population migration.
On average, more boys are born than girls, and the sex ratio among newborns is stable: 105-106 boys per 100 girls. According to physiologists, the male body in infancy is less resilient and more boys die at the beginning of their lives. Further, mortality is modified: in developed countries ah higher mortality of men due to injuries and occupational diseases as well as alcoholism and smoking; in developing countries female mortality is often higher, as a result of early marriage, frequent childbirth, hard work, malnutrition and unequal status in society.
The reasons for the difference in the average life expectancy of men and women are singled out (in Russia, women now live, on average, almost 20 years longer than men):
· the impact of wars, which mainly take the lives of men (this mainly explains the existing gender disproportion in our country);
· Migration, in which mainly men take part;
· the nature of the economy, presenting a different demand for male and female labor. In general, now the number of men in the world is 20-30 million more than the number of women. But the sex ratio among the dead changed. If in 1989 there were 1077 dead women per 1000 dead men, then in 2002 - 866 and in 2003 - 859. In other words, the proportion of women among the dead decreased from 51-52% to 46%.
The preponderance of the number of women over the number of men develops in middle ages as a result of the different rates of extinction of the female and male population (for certain territories, migration processes may also have a certain significance) and increases with the transition to older age groups. In the post-war years, the "female preponderance" was noted already in the younger groups - starting from 25-29 years old, and at the age of 35 years and older it became especially obvious. In subsequent years, the disproportion of the sexes shifted more and more to the older age groups. The results of the 2002 census show that the gender disparity has rejuvenated again. The biologically predetermined excess of the male population over the female population has already been exhausted in the group of 25-29 years. At the age of 30 years and older, there are more and more women compared to male peers - due to the higher mortality of the latter. Compared with the male population, the proportion of older and lower the proportion of younger ages is higher among the female population. The median age of women in Russia was 39.8 years in 2002, and that of men was 34.1 years. The ratio of women to men differs markedly in the regions of Russia. According to current accounting at the beginning of 2004, in 44 regions-subjects of the Russian Federation, the ratio of the number of men and women corresponded to the average for the country or exceeded it, and in some of them quite significantly. In Vladimir, Ivanovo, Nizhny Novgorod, Novgorod, Smolensk, Tver, Tula and Yaroslavl regions, as well as in St. Petersburg, there were from 1205 to 1238 women per 1000 men. But in other regions, the female preponderance was not so significant, and in three regions - the Kamchatka region, the Chukotka and Yamalo-Nenets Autonomous Okrugs, men predominated (926-996 women per 1000 men), and in three more - Koryak, Nenets and Evenk the number of men equaled the number of women. Regions with a younger population are characterized by a smaller gender disproportion, which naturally follows from the nature of gender asymmetry in the Russian age-sex pyramid. Accordingly, the gap in the average age of living men and women is significantly smaller where the gender disproportion is smaller. This gap is maximum in the Central and Northwestern federal districts, and minimal in the Far East. in those regions where at the 1989 census it was noticeably higher than in other regions of Russia. Apparently, this is due to the outflow of men of working age from these areas, who were previously attracted to these areas more than profitable terms work that subsequently changed during the transition to market economy. At the same time, in 18 subjects of the federation, there was a noticeable increase in the number of men per 1,000 women. Among them are Moscow, the Komi-Permyatsky Autonomous Okrug, the Republics of Adygea, North Ossetia, Dagestan, where the growth was more than 20 points and was the result of either a significant entry (Moscow) or a relatively high birth rate (the republics of the North Caucasus). The demographic future of the country is obviously connected with the number of potential mothers - women of reproductive age (the interval from 15 to 44 years is chosen). Over the past 50 years, their number in Russia, despite some fluctuations, has generally grown, now it is greater than ever. The proportion of women of reproductive age varies quite strongly across the regions of Russia - from 21.1% in the Tula and Ryazan regions, to 27.2% in the Yamalo-Nenets 27.4% in the Khanty-Mansi Autonomous Okrugs. The differences between the federal districts are much smaller. Maximum - 24.1% falls on the Ural and Siberian federal districts, at least - 23.3 - for the Central District.
Employment of the population of the Russian Federation
The problems of labor and labor relations have always been side by side with the equally important problem of employment.
Employment is the most important part economic element management, complex in content and structure economic category. Employment is the activity of the able-bodied population associated with the satisfaction of its personal and public needs and, as a rule, bringing him earnings.
The content of the term "employment" includes both the need of people for various types socially useful activity, and the degree of satisfaction of this need. Consequently, the problems of employment of the population do not coincide with the problems of unemployment, since it is necessary to take into account the peculiarities of employment of various socio-demographic groups of the population, the motivation of workers, changes in the structure labor resources and other factors. The goal of ensuring full and productive employment is to achieve an increase in labor efficiency, the formation of an employment structure in accordance with the needs, the improvement of the sectoral and regional structure production, accounting for socio-demographic factors.
Employed are:
1. employed;
2. temporarily absent due to disability, vacation, advanced training, suspension of production;
3. self-employed;
4. appointed or approved to a paid position;
5. serving in the armed forces;
6. able-bodied citizens studying in schools and other educational institutions, including those studying in the direction of the employment service.
The practical need to account for the population necessitates the allocation of types of employment. Thus, a distinction is made between full, productive and freely chosen employment.
Full employment is the provision of professional work that brings income to the individual and a decent existence for him and his family.
Full employment is a goal to strive for. It is achieved when there is an appropriate level of development of the productive forces and the demand for labor coincides with its supply.
The main meaning of productive employment is as follows. Not any work can be considered socially acceptable, but only one that meets two essential requirements. First, employment should bring income to workers, providing decent living conditions for a person. Secondly, productive employment is opposed to formal employment. A special case of the latter - content redundant workers or the creation of formal jobs to avoid unemployment - the policy of the state should help ensure that the work of each person is economically feasible, as productive as possible for society.
Freely chosen employment assumes that the right to dispose of one's own ability to work (labor force) belongs exclusively to its owner, i.e. the worker himself. This principle guarantees the right of every worker to choose between employment and unemployment.
The above types of employment reflect the state of quantitative and qualitative balancing between the population's need for work and jobs, which creates favorable conditions for the socio-economic progress of society.
Employment of the population can be considered effective if it provides a decent income, health, personal development, and the growth of the educational and professional level for each member of society based on the growth of social labor productivity.
The combination of full and effective employment implies the freedom of workers and employers, the abolition of strict state regulation in the field of labor relations, the flexibility of labor in terms of forms of employment, organization of the labor process, and the elimination of obsolete prohibitions in labor activity. On the other hand market relations in the sphere of labor, they assume the right of employers to decide on the quantity and quality of the labor force used and to dismiss workers who are superfluous from the point of view of production.
Problems of employment of the population
The problem of employment of the population is the problem of involving people in labor activity and the degree of satisfaction of their need for work with jobs. It is impossible to achieve such a situation that the entire able-bodied population is employed. After all, some enter the labor force, others leave it, the third are fired or they themselves quit, the fourth are in search of work, i.e. there is a normal movement of the labor force, part of which remains unemployed for a certain period of time.
One of the types of labor market structuring is its division according to demographic and professional characteristics.
Distinguish:
· Youth labor market the situation developing in the Russian youth labor market in last years, is quite tense and is characterized by a tendency to worsen. The scale of registered and hidden unemployment among young people is growing, and its duration is increasing. Fight for survival Russian enterprises leads to tougher conditions for young people to enter the labor market. Meanwhile, the opportunities of young people are already limited due to their lower competitiveness compared to other categories of the population.
The labor market of persons of pre-retirement age and pensioners. It is characterized by low labor productivity, low economic activity, lack or limitation of opportunities for retraining.
Women's labor market. Its peculiarity is the possible long breaks in work associated with the birth and upbringing of children, a decrease in professional abilities for the same reason.
Conclusion
In conclusion, the following conclusions can be drawn:
The age structure has a natural influence on natural movement population, which is expressed in terms of fertility, mortality. The higher the proportion of young ages in the population, the higher the total fertility rates calculated for the entire population of the territory. The higher the proportion of older ages, the higher the value of the total mortality rate. Age is the most important characteristic of any demographic events, which determines the frequency (intensity) of their occurrence.
· Decline in the birth rate is becoming extremely dangerous for Russia. First, the internal potential has been exhausted demographic reproduction. Indeed, in order to replace generations of parents, a birth rate is needed, measured by the total birth rate equal, by at least, 2.1, and today it is only 1.2. Secondly, the population and labor force are aging, people's health is declining, the one-child family is becoming dominant.
In addition, the aging of the population plays an important role, which has adverse economic and social consequences. There is an increase in the proportion of pensioners by age. An exorbitant burden of spending on the payment of pensions falls on pension funds, because the proportion of the working population that makes contributions to these funds is declining. Secondly, the increase in the proportion of older people poses a challenge for society to organize care for them, especially since the proportion of people over 80 years of age is growing faster than the proportion of older people in general. Thirdly, medical care for the elderly, the need for which naturally increases with aging. Medical care requires additional funds, expansion of the network of medical and gerontological institutions, and a qualitative restructuring of the healthcare system.
· despite the state policy in the field of motherhood stimulation, population decline continues.
Bibliography
I Regulations:
1. The Constitution of the Russian Federation
2. Address of the President of the Russian Federation V.V. Putin to the Federal Assembly of the Russian Federation dated April 25, 2005
3. Federal Law of December 29, 2006 N 256-FZ “On additional measures state support families with children
5. The project "Strategies for the socio-economic development of Perm until 2030"
6. Butov V.I., Ignatov V.G. Demography. - M., 2003.-, .Social atlas of Russian regions / Thematic reviews, 2007. - .
7. Vishnevsky A. G. Sickle and ruble. Conservative modernization in the USSR. M.: OGI, 1998- .
8. Data from the Ministry of Health and social development 2009 - .
9. "Demographic Research" No. 1, 2005 - .
10. Women and men of Russia 2010 // Rosstat - , , .
11. Domestic Notes No. 23, 2005 - .
12. Regional studies / Ed. A. A. Morozova. M.: 2004., p. 23-25 - .
13. Russian newspaper 2010 - .
14. Information on the number of registered births, deaths, marriages and divorces for January-May 2010 // Rosstat -.
15. Starovoitova L.I., Zolotareva T.F. Employment of the population and its regulation: Proc. allowance for students. Higher textbook establishments. - M .: Academy, 2003 - p.
16. Total fertility rate // Rosstat -,.
17. Statistics: a course of lectures / Ed. V. G. Ionina. M.: 2002. - .
18. Khalturina D. A., Korotaev A. V. (Ed.). Alcohol disaster and potential public policy in overcoming alcohol supermortality in Russia. Moscow: URSS, 2008. - .
19. Khalturina D.A., Korotaev A.V. Russian cross: Factors, mechanisms and ways to overcome the demographic crisis in Russia. Moscow: URSS, 2006., p.33-35.-.
Appendix 1
The birth rate looks like in the following way:
1980 - 15.9 per 1000 people
1990 - 13.4 per 1000 people
1995 - 9.3 per 1000 people
1996 - 8.9 per 1000 people
1997 - 8.6 per 1000 people
1998 - 8.8 per 1000 people
1999 - 8.3 per 1000 people
2000 - 8.7 per 1000 people
2001 - 9.0 per 1000 people
2002 - 9.7 per 1000 people
2003 - 10.2 per 1000 people
2004 - 10.4 per 1000 people
2005 - 10.2 per 1000 people
2006 - 10.4 per 1000 people
2007 - 11.3 per 1000 people
2008 - 12.1 per 1000 people
2009 - 12.4 per 1000 people
2010 - 12.4 per 1000 people (January-June)
Rosstat data 2010
Annex 2
Population change in 2009
| Number of subjects in a group | Subjects of the Russian Federation included in the group | |
| 1 The number of subjects of the Russian Federation in which the population has decreased | ||
| Total | ||
| including through: | ||
| natural decline and migration outflow of the population | Republics of Karelia, Komi, Mari El, Mordovia; Altai, Perm and Primorsky Territories; Amur, Arkhangelsk, Volgograd, Kirov, Kostroma, Kurgan, Magadan, Murmansk, Omsk, Pskov, Sakhalin, Ulyanovsk regions; Jewish Autonomous Region. | |
| excess of natural loss over migration gain | Chuvash Republic; Khabarovsk region; Bryansk, Vladimir, Vologda, Voronezh, Ivanovo, Kaluga, Kemerovo, Kursk, Leningrad, Lipetsk, Nizhny Novgorod, Novgorod, Orel, Penza, Rostov, Ryazan, Samara, Saratov, Sverdlovsk, Smolensk, Tambov, Tver, Tula, Chelyabinsk and Yaroslavl regions ; | |
| excess of migration outflow over natural increase | Republics of Kalmykia, Karachay-Cherkess, Sakha (Yakutia), North Ossetia-Alania and Udmurt; Trans-Baikal and Kamchatka Territories; Irkutsk region; Chukotka Autonomous Okrug | |
| 2 The number of subjects of the Russian Federation in which the population has increased | ||
| Total | ||
| including through: | Dldtlob | |
| natural and migratory growth | Republics of Bashkortostan, Ingushetia and Khakassia; Krasnoyarsk region; Astrakhan, Tomsk and Tyumen region; Nenets and Khanty-Mansiysk - Yugra autonomous regions | |
| excess of natural increase over migration outflow | Republics of Altai, Buryatia, Dagestan, Kabardino-Balkarian, Tyva and Chechen; Yamalo-Nenets Autonomous Okrug | |
| excess of migration gain over natural loss | Republics of Adygea and Tatarstan; Krasnodar and Stavropol Territory; Belgorod, Kaliningrad, Moscow, Novosibirsk and Orenburg regions; Moscow and St. Petersburg. |
Annex 3
I have right under the windows of the apartment is Kindergarten. Getting ready for work in the morning, I see how mothers lead their children to groups. It seems to me that it is time to build a new kindergarten in our area, as there are no longer enough places. Of course, this is very good, the city is starting to grow.
What is natural population growth
In every corner of our country, and, in general, in the world, various statistics are kept. Specialists constantly monitor the birth and death rates. From these data it is possible to understand how the population is changing. Talks about it natural increase. To calculate it, the number of deaths is subtracted from the number of people born. To get more accurate data, the rate of natural increase of the population is used. Calculations are carried out, as a rule, for one calendar year per 1000 inhabitants.

If the indicator has a positive value, then this indicates that the birth rate exceeds the death rate, and the population is gradually growing. Its negative value indicates the opposite. In such cases, if nothing is done, the population will rapidly decline.
What is the relationship between age and fertility
In addition to the fact that more women or more men live in a certain city, the entire population is divided into three age groups:
- children;
- adults;
- elderly.
Children include the population under the age of 14 years, and adults - from 15 to 64 years. last group are people of retirement age - from 65 years. AT different countries ah, the population size in these groups can differ significantly. Of course, a lot depends on this.

The rate of natural increase is closely related to the age structure of the population. From some regions, young people leave, only older people and children remain. Because of this, the birth rate is declining, well, and the death rate does not stand still. Most often, this picture is observed in villages and villages. AT major cities, where the adult population is quite large, other factors begin to influence the rate of natural increase.
Age composition is one of the most important characteristics of the population and is of considerable interest from the demographic, social and economic points of view. It is used to calculate the available and
The projected number of economically active population, labor resources, pensioners, preschoolers, schoolchildren. It acquires special significance now, when experts from different countries are increasingly concerned about the aging of the nation. This process is becoming global, gradually covering more and more countries.
Considering the age composition of the population, three main age groups are usually distinguished: younger (children from birth to 14 years old), middle (from 14 to 59 years old) and older (elderly) - 60 years or more. This section is the basis for assessing the biological "youth" or "old age" of society. At the same time, some sources use a different gradation of the population of the middle and older age groups - 15-64 and 65 and older. For this reason, we will have to use data corresponding to both one and the other approach.
The age structure of the world's population depends on the following factors: fertility, mortality, life expectancy. If we are talking about a particular country or territory, then the influence is added to them historical events(primarily related to military operations), population policy and migration. In turn, many demographic indicators, primarily birth and death rates, depend on the age composition. Thus, with an increase in the proportion of the population of the older age group, the first indicator decreases, and the second increases.
In 2005, the population of the younger age group in the world was 27.8%, the middle (aged 15-64) - 64.9%, the older aged 65 years and older - 7.3% (in 2008 - 27 , 3, 65.1 and 7.6% respectively). At the same time, there are significant differences between countries depending on the level of development. In developed countries, the population of the younger age group was 17%, the middle - 63%, the older - 20%, in the less developed countries - 32, 60 and 8%, respectively, and in the least developed - 43, 52 and 5%. Attention is drawn to the significant gap in the proportion of the younger and older age groups between the first and the other two groups. In more developed countries in 1998, a peculiar and very symbolic demographic revolution took place - the proportion of the population of the older age group exceeded the proportion of the population under the age of 14. According to forecasts, in 2050 a similar revolution will take place all over the world - 21.1% of the elderly against 21% of children.
So, we can distinguish two main types of age structure of the population: the first characterizes more developed countries, as well as a number of countries in Asia and Latin America(first of all, new industrial ones), the second - the majority of representatives of the second and third groups (the majority of developing ones). The more developed countries "survived" the population explosion, and its "echoes" can be clearly seen in the age structure. Precisely because of population explosion, which took place in the 50-60s, more than 60% of the population of these countries are people aged 15 to 60 years. This group of countries is characterized by: a reduced proportion of children, in some countries has reached record low levels, and a large percentage old people. Attention is drawn to the clear predominance of European countries, as well as a large number of post-socialist states, which are characterized by extremely low birth rates.
Developing, they are distinguished by a large percentage of the population of childhood (from a third and above) and a small proportion of the elderly. All these figures are easy to explain: countries of this type have a high birth rate, a large natural increase, and life expectancy is negligible. Moreover, high rates of the share of the population of the younger age group and low rates of the older age group characterize the poor countries of the world. Let's illustrate this with a table. All states presented in the table belong to the group of the least developed countries of the world, except for Yemen and Afghanistan, this is Africa.
As the demographic transition phases pass and life expectancy increases, the situation in developing countries will change: the proportion of children will decrease, the proportion of the population of middle age and then the elderly will increase. These “transformations” will affect not only the age structure, but also the social and economic situation. It is known that the rapid increase in the population in developing countries does not have the positive potential that was noted in developed countries, on the contrary, most often it negatively affects the economies of backward countries. This increases the pressure on cultivated land, exacerbates the food problem, raises the question of creating new jobs and increasing access to educational establishments(57 million boys and 96 million girls in developing countries, aged 15-24 cannot read or write) . In addition, population aging is expected to be faster in developing countries than in developed ones.
In general, the world is maturing, or rather, its population is maturing. In the mid-70s of the last century, the median average age of the world population was 22.9 years; today it is 27.6 years (27 years for men and 28.2 for women). By 2050, the global median age is expected to exceed 36 years, with a sharp increase in the proportion of the population of the older age group.
“Growing up” does not occur in all countries at the same time, but gradually: in many developing countries, while “childhood and youth” prevail, this is especially characteristic of the least developed countries, “adult”, one might say, “mature”, looks like the population of developed and post-socialist countries. In the future, the world will begin to age, the proportion of older people has been growing throughout the second half of the twentieth century. Today, the world's older population is growing by 2% annually, substantially faster than the population as a whole. It is expected that this trend will not only continue, but will intensify in the coming decades. Thus, the growth rate of the population aged 60 years and older in 2025-2030 will reach 2.8% per year. This is facilitated not only by a decrease in the birth rate, but also by an increase in average life expectancy, this indicator for the world as a whole increased from 46 years in 1950-1955 to 65 years in 2003, and in developed countries, on average, they live up to 76 years, in less developed countries - 63 years, and in the least developed countries - 50 years (in the least developed countries, life expectancy is one third shorter than the life expectancy of representatives of the "golden billion").
Growth and reproduction of the population are determined by the ratio between the numbers of births and deaths or between birth and death rates.
There are certain similarities and interactions between population growth and reproduction. But there is a difference between these concepts. Thus, the population may continue to grow for a long time, while its reproduction has already become narrowed, i.e. each subsequent generation is numerically smaller than the previous one. This is due to the fact that the age structure of the population carries some potential demographic growth. In addition, population growth is also associated with migration processes. Under the regime of expanded reproduction of the population, its number may decrease. This is possible when the share of the reproductive part of the population becomes sufficiently small in comparison with the share of its elderly part. In this case, a high birth rate will not be able to compensate for a significant number of deaths. This is also explained by the potential for population growth, which is typical for the age structure of the population, but, of course, with a negative value.
Population growth or its increase (which is actually the same) is characterized by general rate of natural increase, which is the ratio of the natural increase of the population to its average (average annual) number.
The main drawback of this coefficient is the dependence of its value and dynamics on the characteristics of the age structure of the population and its changes. Thus, with a younger age structure, even with a moderate birth rate, a relatively high number of births will be observed due to a large number and share in the total population of young married couples and at the same time a relatively smaller number of deaths. As a result, the difference between the number of births and deaths will be correspondingly greater, i.e. natural increase and coefficient of natural increase.
With the aging of the age structure of the population, the number of deaths will increase even if the mortality rate in each age group remains unchanged and, ultimately, the natural population growth and the rate of natural increase will decrease. This trend is typical for economically developed countries with low birth rates, as well as for Russia.
To improve the quality of measuring the level of population dynamics, indicators of population reproduction are used, which do not depend on the structure of the population and, above all, on the sex and age structure. This gross and net reproduction rates of the population, as well as true rate of natural increase.
In contrast to the coefficient of natural increase, these indicators characterize the change in the population not for a year, but for a period of time during which the parental generation is replaced by the generation of their children. Due to the fact that the replacement of generations is characterized by the ratio of births and deaths, and mortality varies significantly between men and women, population reproduction rates are calculated separately for each sex and most often for women. This does not take into account the external migration of the population.
Gross ratio population replacement is defined as the total fertility rate, but only girls are taken into account in the calculations, since the total fertility rate is multiplied by the proportion of girls among newborns. Thus, the gross reproduction rate of the population shows the number of girls that an average woman gives birth to in her entire life. At the same time, the condition is set that none of the girls and their daughters die before the end of the reproductive period (up to 50 years). Because of this, this coefficient is very rarely used in practical work. important place in the practice of calculations takes net reproduction rate of the population, or net reproduction rate.
Net reproduction rate of the female population is calculated as the sum of the products of age-specific fertility rates and the corresponding number of living women from the mortality tables for the same period, multiplied by the proportion of girls among those born in the years for which the coefficient is calculated. It shows how many, on average, girls born to the same woman throughout their lives would have survived to their mother's age at birth, if the birth and death rates of a given period were maintained at each age. This coefficient characterizes the degree of replacement of a generation of women by their daughters with a long-term preservation of the existing levels of fertility and mortality. As a result, the net reproduction rate of the population is a generalized characteristic of the level of births and deaths that exists in a given period.
The net reproduction rate of the population, which characterizes, as noted, the replacement of the generation of mothers by the generation of their daughters, is quite often interpreted as an indicator of the replacement of generations in the entire population as a whole (men and women).
If this coefficient is equal to 1.0, then this means that the ratio of the birth rate and mortality rate ensures a simple reproduction of the population through periods of time equal to the average age of mothers at the birth of daughters. Moreover, this average age varies slightly in direct proportion to the height of the birth rate within the range between 25 and 30 years. If the net coefficient is greater or less than 1.0, then this means a correspondingly expanded reproduction of the population, when the generation of children is numerically larger than the parental one, or a narrowed reproduction of the population, when the generation of children, taking into account their survival to the average age of the parents, is numerically smaller than the parental one.
In addition, often use the indicator, which is called " life span» (the average age of mothers at the birth of daughters) and is defined as the arithmetic mean of the average ages for each five-year age interval, weighted by the proportion of newborn girls surviving to the age of their mothers at the time of their birth.
Thus, the net reproduction rate of the population makes it possible to assess the state of the existing population reproduction regime from the standpoint of its probable further development, characterizes not the current demographic situation, but its limiting state in some future, provided that this reproduction regime will not change.
Based on the considered coefficients, we can determine true rate of natural increase. It characterizes the population growth for each year and, like the net coefficient, does not depend on the age structure of the population. The true coefficient of natural population growth is approximately determined by the formula proposed by the American demographer E. Cole in 1955. This is the quotient of dividing the net reproduction rate of the population by the length of the female generation (the average age of the mother at the birth of daughters).
Among demographers, the issue of the role of fertility and mortality in the reproduction of the Russian population is being discussed. Calculations made (Borisov V.A., 2001) for the period 1986-1996. showed that the net reproduction rate of the population of Russia decreased by 41.9% as a whole, including 41.4% due to a decrease in the birth rate and only 0.5% due to an increase in mortality. As a result, it is possible to full confidence state that the most important and determining factor on which the demographic future of the country depends is the birth rate.
78. Types of age composition of the population, aging of the population.
Age composition of the population. The age composition of the population is the distribution of the population by age groups in order to take into account the study of demographic and socio-economic processes.
In the age structure, the population is usually distributed into one-year or five-year age groups. However, to assess the overall structural shifts, an enlarged distribution into three age groups is used: 0-14 years old, 15-49 years old, 50 years and older. Another distribution option is possible: 0-14 years old, 15-59 years old, 60 years and older.
Based on the calculation of the proportion of persons aged 0-14, 15-49, 50 years and older, the age type of the population is determined. By age structure There are progressive, regressive and stationary types of population.
Progressive population type - the proportion of children aged 0-14 exceeds the proportion of the population aged 50 and older. The progressive type of population ensures a further increase in the population.
Regressive type - the proportion of people aged 50 and over exceeds the proportion of the population from 0-14. The regressive type threatens the nation with extinction.
Stationary type, - the ratio of these groups is approximately the same.
However, the age of 50 for most countries is the age of the working-age population, and it is not always advisable to take it as a basis for determining the type of age composition. Therefore, the level of demographic "old age" of the population is determined by the proportion of people aged 60 years and older (Garnier scale). It is believed that if there are more than 12% of people aged 60 years and older among the population, then this is a demographically old type of population.
According to the UN classification, a population is considered demographically old when the proportion of people aged 65 years and over exceeds 7%.
The ratio of the number of men and women has a significant impact on the natural movement and reproduction of the population.
The distribution of the population by sex is usually measured by the percentage of men and women in the total population, or by the number of men per 100 or 1000 women.
The sex composition of the population is formed under the influence of the sex ratio at birth and differences in mortality between men and women.
For every 100 girls, an average of 103 to 107 boys are born. However, due to the higher mortality of men with increasing age, the ratio of men and women gradually levels off, and then women begin to predominate numerically. This trend towards gender disproportion is characteristic of almost all countries.
The gender composition of the population is influenced by:
1) wars leading to the loss of a predominantly male population;
2) population migration, as men of working age migrate more often than women.
The composition of the population by sex affects population growth, natural movement and reproduction, because, other things being equal, the more women of reproductive age, the greater the number of births.
79. Mechanical movement of the population. The value of migration for practical health care.
mechanical movement population.
Population migration is the movement of people (migrants) across the borders of territories with a permanent change of residence or for more or less long periods.
Migration flow- this is the total number of migrants, or migrations, having common areas of arrival and departure during a specific period of time.
Depending on whether a given territory exchanges population with others, there are open and closed population. An example of an open population is the population of any city. Absolutely closed is only the population of the entire globe.
Migration is divided into:
1) for irrevocable - with a permanent change of permanent place of residence;
2) temporary - resettlement for a sufficiently long but limited period;
3) seasonal - movement during certain periods of the year;
4) on the pendulum - regular trips to the place of work or study outside their locality.
There are also:
1) external migration - migration outside their country. It applies emigration - departure of citizens from their country to another country for permanent residence or long term and immigration - entry of citizens from another country into this one.
2) internal migration - movement within the country. It includes inter-district resettlement of the population and the resettlement of residents from the village to the city.
Importance of migration for public health authorities:
1) migration to cities contributes to the process of urbanization, which leads to a change in the environmental situation, requires a revision of the standards of medical care, changes in the network of medical institutions, changes the structure of morbidity and mortality of the population, affects the epidemic situation in the region;
2) pendulum migration increases the number of contacts that contribute to the spread of infectious diseases, leads to an increase in stressful situations and injuries;
3) seasonal migration leads to an uneven seasonal workload of healthcare facilities, affects the health of the population;
4) health indicators of migrants differ significantly from those of the indigenous population.
Data on population migration are obtained as a result of the development of coupons for statistical registration of arrivals and departures, which are compiled simultaneously with address sheets at registration and discharge and are received from the internal affairs bodies. Statistical coupons filled in for persons who changed their place of residence within the given urban settlement, or between rural settlements within the administrative region, are not filled out.
To assess migration processes, a number of indicators are calculated. Most commonly used:
1) the number of arrivals per 1000 population;
2) the number of dropouts per 1000 population;
3) migration growth;
4) migration efficiency coefficient.