Analysis of short-term debt, being the most important part of the activities of the accounting department and the entire system financial management organization, allows its management to:
determine how the amount of debt obligations has changed compared to the beginning of the year or other analyzed period;
assess whether the ratio of accounts receivable and accounts payable, and if not, how to achieve its optimality, what needs to be done for this;
identify and assess the risk of short-term debt, its impact on the financial condition of the organization, establish acceptable limits for this risk, measures to reduce it;
find a rational relationship between the amount of short-term debt and sales volume, evaluate the feasibility of increasing the release of products, goods and services on credit, determine the limits of price discounts to speed up the payment of invoices;
predict the state of the organization's debt obligations within current year, which will improve financial results her activities.
Information for the analysis of the actual amount of short-term debt is contained in the balance sheet, in the appendix to it, in the explanatory note and registers of synthetic and analytical accounting. Short-term accounts payable in the balance sheet are presented in total amount and in the context of settlement accounts with a credit balance.
Information on the amount and structure of debt obligations in the balance sheet is interconnected with the indicators of the items in section 2 "Accounts receivable and accounts payable" of Form No. 5, which reflects data on changes in accounts receivable and short-term accounts payable for the reporting year. This allows you to analyze debentures enterprises in the areas of their occurrence or receipt, types of receivables and short-term debts, the degree of compliance with the terms of payments and other grounds.
According to the balance sheet, appendices to it and explanatory note one can judge the degree of security of obligations and payments received and issued, the dynamics of the movement of bills, the change in debt obligations of buyers for the goods (services) supplied to them by their actual cost. Analysis of the structure of short-term debt in the context of legal and individuals is done on the basis of analytical accounting data.
Debt analysis is an integral part of assessing the liquidity of an enterprise, its ability to repay its obligations. To do this, it is necessary to study and compare the volumes and distribution over time. cash flows, analyze trends in the ratio of short-term debt and the total amount of debt obligations, the ratio briefly urgent debts and received income. The growth trend of these indicators indicates the possibility of problems with the solvency and liquidity of the enterprise. Indirectly, this conclusion is confirmed by the increase in the terms of settlements with creditors.
Analysis of short-term debt according to data financial reporting enterprises include:
analysis of the dynamics and structure of short-term liabilities;
analysis of the turnover of short-term debt;
analysis of the impact of debt obligations on the solvency, liquidity and financial stability of the enterprise.
When analyzing indicators that characterize debt claims and obligations, first of all, they study their dynamics, the causes and prescription of occurrence, and compliance with the statute of limitations.
A significant share in the composition of the sources of funds of the enterprise is occupied by loans, including accounts payable. The relative increase in short-term debt has a twofold effect. On the one hand, this phenomenon is favorable, since the enterprise has additional source financing. On the other hand, an excessive increase in short-term debt is extremely dangerous, since it increases the risk of possible bankruptcy.
The stages of express analysis of short-term accounts payable coincide with the stages of express analysis of receivables. At the first stage of the analysis, the change in the share of short-term debt in the total amount of funding sources and in the value of all liabilities is characterized based on the balance sheet data.
Table 3
Analysis of the share of short-term liabilities in the liabilities of the enterprise JSC "URALSVYAZINFORM" for 2009-2010.
In 2010, short-term liabilities at JSC "URALSVYAZINFORM" decreased by 830.3 thousand rubles. The share of short-term accounts payable in the total value of the company's financing sources decreased from 11.77% to 9.13%. From the point of view of current solvency and liquidity, such dynamics is favorable for the analyzed enterprise, as it indicates that it had enough own funds to make current payments.
At the next stage of the analysis of short-term debt, its composition and structure are studied according to the data of the II section of the asset of the Balance Sheet.
Table 4
Analysis of the structure of short-term debt of OAO "URALSVYAZINFORM" for 2009-2010.
|
Settlements with debtors (composition of accounts receivable) |
Change for 2010 |
|||||
|
amount, thousand rubles |
Amount, thousand rubles |
Amounts, thousand rubles |
Oud. weight, % |
|||
|
1. Short term financial obligations |
||||||
|
1.1 Other current financial liabilities |
||||||
|
2. Short-term trading obligations |
||||||
|
2.1 Trading account liabilities |
||||||
|
2.2 Advances received |
||||||
|
3. Short-term accrued liabilities |
||||||
|
3.1 Pay obligations |
||||||
|
3.2 Obligations to staff for other operations |
||||||
|
3.3 Insurance liabilities |
||||||
|
3.4 Accounting obligations |
||||||
|
3.5 Obligations to founders and other participants |
||||||
|
3.6 Other current liabilities |
||||||
|
4. Total current liabilities |
As can be seen from Table 3, in the analyzed enterprise JSC "URALSVYAZINFORM" during 2010 there is a decrease in the value of short-term accounts payable of 830.3 thousand rubles. This decrease was mainly caused by the repayment of liabilities on trading accounts in the reporting period, as a result of which their share decreased by 15.32%, and the performance indicator eventually decreased by 1,170.3 thousand rubles. The decrease in the cost of liabilities for settlements with the budget also had a significant impact, the share of which decreased by 16.08%, which led to a decrease in short-term liabilities by 913.7 thousand rubles. In the reporting period, there is an increase in wage obligations. Specific gravity this indicator increased in the reporting period by 14.57%, causing an increase in short-term liabilities by 488.5 thousand rubles. Share financial debts in the total value of short-term short-term debt decreased by 0.01%, the share of trade liabilities decreased by 6.29%. At the same time, the share of accrued liabilities increased by 6.3%.
Thus, we can conclude that the analyzed company during the reporting period as the main source of financing assets short-term accrued liabilities. Accrued but not paid wage, other short-term liabilities can be temporarily used as sources of financing, and free of charge, since, unlike bank loans You don't have to pay interest on using them. However, it should be borne in mind that the company cannot fully control such accruals, since the timing of their payments is regulated external factors, including the current legislation, the change of which does not depend on the plans and capabilities of the enterprise.
At the third stage of the analysis of short-term accounts payable, a characteristic of its turnover is given. For this, the number of revolutions is calculated and middle period regulation of accounts payable (turnover of short-term debt in days) for the reporting year, which are then compared with similar indicators for the previous year. There are several ways to determine the turnover of short-term debt, which differ in the basis used for calculations. In particular, turnover can be calculated as the ratio of sales revenue or cost of sales to the average short-term debt. The calculation of these indicators by two methods, carried out on the basis of the data of the Balance Sheet and the Statement of Financial Results, is presented in Table 5.
Table 5
Analysis of the turnover of short-term debt in OAO "URALSVYAZINFORM" for 2009-2010.
|
Indicators |
Change |
||
|
1. Income from sales, thousand rubles. |
|||
|
2. Cost of sales, thousand rubles. |
|||
|
3. Average value of short-term liabilities, thousand rubles. |
|||
|
3. Number of turnovers of short-term debt |
|||
|
3.1 Based on sales revenue |
|||
|
3.2 Based on cost of sales |
|||
|
4. Period of repayment of accounts payable, days |
|||
|
4.1 Based on sales revenue |
|||
|
4.2 Based on cost of sales |
As can be seen from the calculations presented in Table 4, the ratio of sales revenue and average cost short-term liabilities indicates a positive trend: if in the previous year each of the short-term debts accounted for 8.14 rubles. income from sales, then in the reporting year - 9.79 rubles, that is, more by approximately 20% (8.14: 9.79100-100).
The number of turnovers of short-term debt calculated on the basis of cost of sales is much less than that calculated on the basis of sales revenue. The dynamics of this indicator confirms the acceleration of the turnover of short-term liabilities. Thus, the number of turnovers increased from 5.24 to 6.34 times, and the average duration of one turnover decreased by 11.92 days compared to the previous year and amounted to 56.78 days. This trend indicates that the company is able to timely regulate accounts payable and other short-term liabilities.
At the final stage of the analysis of short-term liabilities, their structure is characterized by the nature of repayment. For this purpose, based on data from the appendix to balance sheet share is calculated current liabilities(the due date for which has not come) and the share of overdue liabilities in the context of each type of short-term debt.
Table 6
The structure of short-term accounts payable by the nature of repayment in JSC "URALSVYAZINFORM"
|
Type of debt |
Total at the end of 2010 |
Including |
|||
|
The due date for which has not yet arrived |
Overdue |
||||
|
Up to 3 months |
From 3 months to 1 year |
Over 1 year |
|||
|
1. Other short-term financial liabilities, thousand roubles. % |
|||||
|
2. Short-term liabilities on trading accounts, thousand rubles. % |
|||||
|
3. Advances received, thousand rubles. % |
|||||
|
4. Liabilities to personnel, thousand rubles % |
|||||
|
5. Liabilities to personnel for other operations, thousand rubles % |
|||||
|
6. Liabilities for insurance, thousand rubles. % |
|||||
|
7. Liabilities for settlements with the budget, thousand rubles. % |
|||||
|
8. Liabilities to founders and other participants, thousand rubles % |
|||||
|
9. Other short-term liabilities, thousand leva % |
|||||
|
Total, thousand rubles % |
As can be seen from Table 5, 55.25% of all short-term accounts payable are debts that are not due. Therefore, one should pay attention Special attention for arrears. Other short-term financial liabilities are overdue for more than a year in full, in the amount of 14.5 thousand rubles. Of the total amount of short-term liabilities on trading accounts, 1484.3 thousand rubles. or 84.11% are overdue for more than one year. The obligations to the founders and other participants are overdue in full, 39.5 thousand rubles. or 31.98% of the value of this indicator are overdue for more than one year. The cost of advances received, overdue from 3 months to the bottom year, amounted to 478 thousand rubles. or 94.02% of the total value of advances received.
1538.3 thousand rubles or 31.84% of the value of short-term accounts payable is overdue for more than one year. This is a negative moment in the activity of the analyzed enterprise OAO "URALSVYAZINFORM". Untimely repayment (late) of their debts is fraught with the fact that suppliers of raw materials and materials will require prepayment.
We carry out horizontal and vertical balance analysis
We evaluate changes in the state of property and capital based on financial ratios
We make a short-term forecast of the state of solvency
Suggest actions to improve financial condition
In order to make timely management decisions, complete reliable transparent information is needed. Specialists conduct an express assessment of the company's financial condition on the basis of the balance sheet.
We collect information for express analysis
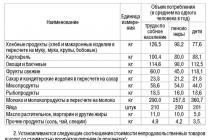
How to analyze the financial condition of an enterprise and develop measures to improve it, let's consider the example of a regional company that produces confectionery. The company's balance sheet is presented in Table. 1, the results of calculations of financial ratios and liquidity ratios - in table. 2, 3.

Calculate the coefficient of loss (recovery) of solvency:
- by the end of the year, the coefficient of provision with own working capital is less than the normal value (≥ 0.1);
- the current liquidity ratio is less than the normal value (2.0), but there is a tendency for the indicator to grow.
Let's evaluate the possibility of restoring solvency in the next 6 months:
solvency recovery ratio = (1.14 + 6 / 12 × (1.14 - 1.1169)) / 2 = 0.58 (< 1,0).
Thus, the management of the enterprise should form rational management decisions in order to restore the solvency of the enterprise in the next 6 months.
Analyzing the results
Based on the results of the analysis, the following conclusions can be drawn:
1. Balance currency decreased by the end of the year by 12,414 thousand rubles. (-16.71%). This suggests that the assets and capital of the organization, i.e., its main activity, have decreased. Reasons for the decline:
- reduction in equity (primarily losses; see balance sheet line “Equity and reserves”);
- financing capital investments through short-term liabilities. Growth non-current assets in the balance sheet under the section "Outside current assets» exceeds the total growth of equity and long-term liabilities under the sections “Capital and reserves” and “Long-term liabilities”.
2. Value non-current assets increased due to fixed assets (+362 thousand rubles, or +27.61%) and intangible assets. According to the results of the vertical analysis, it can be seen that the ratio of non-current assets to the balance sheet at the end of the year (5.77%) increased by 2.64% compared to the beginning of the year (3.13%). This is a positive result, indicating an increase in the production potential of the organization.
3. Value current assets decreased in all positions (except for VAT and short-term financial investments) and by 13,659 thousand rubles. (-18.98%).
Inventories decreased by 62.07%, which indicates a drop in production volumes, a reduction in stocks of raw materials and finished products.
4. Accounts receivable decreased by 10.82% (5360 thousand rubles), however, the share of this balance sheet item for reporting period increased by 4.72%.
Note
The difference in the results of calculations of accounts receivable during the horizontal and vertical analysis arose due to the fact that the accounts receivable decreased not as significantly as the balance sheet total. Therefore, the growth in the share of receivables in the structure of property is a negative fact, which indicates a decrease in the mobility of property and a decrease in the efficiency of turnover.
5. According to the results of horizontal analysis, decreased and accounts payable- by 20.43% (13086 thousand rubles). This indicates a reduction in urgent debts. Vertical analysis showed a decrease in the share of accounts payable by 3.85%.
On the one hand, this contributes to the growth of the liquidity of the organization, but on the other hand, it reduces the amount of accounts payable by half. more reduction receivables, and this leads to a reduction in own working capital and a decrease in financial stability organizations.
6. Value equity decreased by 2193 thousand rubles. (-32.68%) due to the reduction in the volume of retained earnings, i.e., the financial performance of the organization worsened, the margin of financial stability decreased.
7. Reduction long-term liabilities talks about the repayment of debts to banks. But the absence of short-term loans and borrowings in the capital structure, while reducing accounts payable, may indicate a low creditworthiness of the organization.
8. Dynamics financial ratios speaks of a decrease in the mobility of turnover and property in general; reduction in production possibilities as a result of the reduction production stocks. A positive moment is the growth in the provision of reserves with own funds.
9. Odds financial independence(autonomy, involvement, "shoulder") show the share of own (borrowed) capital in the total sources of funds.
Note
The structure of capital depends on the scope of the organization. For industrial enterprises the recommended share of equity in the total amount of sources of funds is at least 50%. The growth in the share of equity capital is regarded positively, as it reduces the level financial risk and strengthens the financial stability of the organization.
In the organization under consideration, the value of the autonomy coefficient is low and continues to decline: at the beginning of the year, equity capital was only 9% of the total capital, at the end of the year - 7.3%.
10. Meaning equity maneuverability ratio at the beginning of the year - 1.1788 (> 1) - indicates that the turnover is provided by long-term borrowed funds, which increases the risk of insolvency.
11. Ratio absolute liquidity shows what part of the current debt can be repaid in the nearest time to the time of the balance sheet, which is one of the conditions for solvency. The normal value is 0.2-0.5.
The actual value of the coefficient (0.02) does not fit into the specified range. This means that if the balance of funds is maintained at the level of the reporting date (due to the uniform receipt of payments from partners), the existing short-term debt will not be able to be repaid in 2-5 days.
12. Ratio urgent liquidity reflects the predicted payment capabilities of the organization, subject to timely settlements with debtors. The value of this coefficient should be » 0.8.
In our problem, the quick liquidity ratio = 0.83. It can be concluded that the organization is able to pay off its debt obligations (non-term), subject to the timely repayment of receivables. 13. Current liquidity ratio (coverage) shows the extent to which current assets cover short-term liabilities. It characterizes the payment capabilities of the organization, subject not only to timely settlements with debtors and the favorable sale of finished products, but also in the event of the sale, if necessary, material working capital.
The level of the coverage ratio depends on the industry, the duration of the production cycle, the structure of stocks and costs. Norm - 2.0< Ктл< 3,0, т. е. на каждый рубль краткосрочных обязательств приходится от двух до трех рублей ликвидных средств.
Failure to comply with this standard (in the considered balance sheet Ktl = 1.14) indicates financial instability, varying degrees of liquidity of assets and the inability to quickly sell them in case of simultaneous application of several creditors.

Why did the financial condition of the enterprise worsen and is it possible to correct the situation?
The situation in the organization has deteriorated, most likely due to inefficient management decisions. This problem is due to:
- lack of strategy in the activities of the enterprise and focus on short-term results to the detriment of medium and long-term ones;
- low qualification and inexperience of managers;
- a low level of responsibility of the company's managers to the owners for the consequences of the decisions made, for the safety and effective use property of the enterprise, as well as for the financial and economic results of its activities.
- increase the transparency of enterprise management;
- optimize the activities of the enterprise in accordance with the results achieved and the benefits received from certain implemented projects;
- clearly set tasks for the staff and evaluate the results of their work in accordance with the goals and results of the projects;
- increase the degree of cost control in the enterprise ( special character budgeting, planning, control and accounting);
- gain experience and create your own knowledge base at the enterprise;
- link the results of anti-crisis management with the motivation of managers and specialists involved in this process.
Anti-crisis management will also create favorable conditions for the functioning of the company, will contribute to its exit from an unstable financial and economic state. At the same time, it is necessary to control the feasibility of the measures taken and evaluate their effectiveness.
The mechanism for increasing the anti-crisis stability of the enterprise:

The main role in the system of anti-crisis management of the company is given to internal mechanisms financial stabilization.

As for our example, in order to overcome the crisis, a company needs to try to find internal reserves to increase profitability and economic efficiency activities, namely:
- revise pricing policy;
- increase production volumes;
- improve product quality;
- to sell products in more optimal terms;
- accelerate the turnover of capital and current assets;
- increase profitability and ensure the break-even operation of the enterprise;
- sell products in more profitable markets.
To reduce accounts receivable, you can take out a loan. But according to the results of the analysis, the company is 82.38% dependent on creditors. Therefore, it is important:
- carefully monitor the structure and dynamics of accounts payable;
- conduct continuous monitoring of accounts payable;
- timely identify and eliminate negative trends;
- constantly monitor the status of settlements with buyers and suppliers on overdue debts.

The balance sheet asset contains information about the placement of capital at the disposal of the enterprise. The main feature of the grouping of assets of the balance sheet is the degree of their liquidity. On this basis, all assets are divided into long-term (fixed capital) and current (current) assets. The placement of enterprise funds is of great importance. The results of production and financial activities, and, consequently, the financial condition of the enterprise, largely depend on what funds are invested in fixed and working capital, how much of them are in the sphere of production and the sphere of circulation, in monetary and material form. Therefore, in the process of analyzing the assets of an enterprise, first of all, it is necessary to study changes in their composition, structure and evaluate them.
To analyze the asset items, we will use the development table 1. From the data in table 1 it follows that during the analyzed period the property of the enterprise increased significantly, the growth rate was 159.8%. This happened mainly due to the growth of immobilized assets, which increased by 91.8%.
The current assets of the enterprise also increased, the increase was 29.5%. The largest increase occurred in the item "Accounts receivable", the growth rate was 80.2%. For the analyzed period cash enterprises increased by 39.4%. As for the inventory item, there is a decrease of 33.8%.
Table 1
Analytical grouping and analysis of balance sheet assets
For a more detailed analysis of the structure of assets, we will use Table 2. According to Table 2, it can be seen that during the reporting period, the structure of the assets of the analyzed enterprise has changed significantly: the share of fixed capital has increased, and the share of working capital, respectively, decreased by 9.7 percentage points. Among non-current assets, the largest share belongs to fixed assets.
The state of inventories has a great influence on the financial condition of the enterprise. The presence of smaller but more volatile inventories means that a smaller amount of financial resources are frozen in inventories. The presence of large stocks indicates a decline in the activity of the enterprise. The share of inventories decreased by 12 percentage points. This was largely facilitated by a decrease in the share of finished products by 8.2 points, which indicates an acceleration in capital turnover.
It is necessary to analyze the impact on the financial condition of the enterprise changes in accounts receivable. If the company expands its activities, then the number of buyers and receivables grow. Consequently, the growth of receivables is not always evaluated negatively. It is necessary to distinguish between normal and overdue debt. The presence of the latter leads to a slowdown in capital turnover. In our example, the share of receivables increased by 3.1 percentage points, with a significant increase in the share (by 9.6 points) under the item “Buyers and customers”, and a decrease by 4.4 points under the item “Advances issued”.
table 2
Detailed analysis of asset balance sheet items

An increase in cash in the accounts indicates, as a rule, the strengthening of the financial condition of the enterprise. Their amount should be sufficient to pay off priority payments. However, the presence of large cash balances over a long period of time may be the result of improper use of working capital. According to our example, at the end of the reporting period there was a slight decrease in the share of cash - by 0.8 percentage points.
If the assets of the balance reflect the funds of the enterprise, then the liabilities are the sources of their formation. The financial condition of the enterprise largely depends on what funds it has at its disposal and where they are invested. According to the degree of ownership used capital is divided into own and borrowed. According to the duration of use, long-term (permanent, permanent) and short-term capital are distinguished.
Let's start the analysis of the liabilities side of the balance sheet by reviewing Table 3. During the analyzed period, the growth rate of the sources of the enterprise's property amounted to 159.8%. This was largely due to an increase in equity capital by 61.3%. This fact positively characterizes the financial stability of the enterprise.
Borrowed capital for the analyzed period increased by 55%. The largest increase occurred in the item "Accounts payable" - by 89.1%, as well as in the item "Short-term credits and loans" - by 77.1 percent. When analyzing accounts payable, it should be borne in mind that it is also a source of coverage for receivables. In our example, at the beginning of the period, receivables exceed accounts payable by 77,061 thousand rubles (130,799 - 53,738), at the end of the period - by 134,128 thousand rubles. (235723 - 101595). This testifies to the immobilization of own capital into accounts receivable and negatively characterizes the financial condition of the enterprise.
Long-term liabilities decreased by 9.4%. The increase in long-term liabilities could be seen as a positive factor, since they are equal to equity. A decrease in long-term liabilities, along with an increase in short-term ones, can lead to a deterioration in the financial stability of an enterprise.
Table 3
Analytical grouping and analysis of balance sheet liability items
|
Balance liability |
Back to top |
Finally |
Absolute |
Pace |
Pace |
|
period |
period |
deviation |
growth, % |
growth, % |
|
|
Sources of property - total |
|||||
|
Borrowed capital |
|||||
|
including |
|||||
|
long term duties |
|||||
|
accounts payable |
A more detailed analysis of the balance sheet liability items is carried out using table 4. Table 4 shows the structure of the balance sheet liability. The largest share in the sources of property is occupied by equity capital, consisting of authorized capital, retained earnings of previous years and retained earnings of the reporting year. The share of own capital in the structure of property sources increased by 0.7 percentage points. This indicates an increase in the independence of the enterprise. However, it should be borne in mind that financing the activities of an enterprise only at its own expense is not always beneficial for it, especially in cases where production is seasonal. In addition, it should be borne in mind that if the prices for financial resources low, and the company can provide a higher level of return on invested capital than it pays for credit resources, then by attracting borrowed funds, it can increase the return on equity.
The share of debt capital decreased by 0.7 percentage points as a result of an increase in the share of equity capital. The share of long-term liabilities decreased by 3.2 points. The share of short-term loans increased by 0.7 percentage points, the share of accounts payable - by 1.8 points. The structure of accounts payable also changed: the share of liabilities under the item “Suppliers and contractors” increased by 2.4 percentage points; the share of debt to personnel decreased by 0.3 points.
In general, the financial condition of the enterprise is characterized positively.
Table 4
Detailed analysis of liability items, thousand rubles
|
Balance liability |
At the beginning of the period |
At the end of the period |
Deviation |
||
|
percent to the end |
percent to the end |
in percentage paragraphs |
|||
|
Sources of property - total |
|||||
|
Equity |
|||||
|
Borrowed capital |
|||||
|
including |
|||||
|
long term duties |
|||||
|
short-term credits and loans |
|||||
|
accounts payable |
|||||
|
suppliers and contractors |
|||||
|
debt to staff |
|||||
|
debt to extrabudgetary funds |
|||||
|
debt to the budget |
|||||
|
advances received |
|||||
In conditions market relations the role of the analysis of the financial condition of the enterprise is exceptionally great. This is due to the fact that the enterprise acquires independence and bears full responsibility for the results of its production. economic activity before members of the enterprise, employees, bank and creditors.
Financial statements are a set of data characterizing the results of the financial and economic activities of the enterprise for the reporting period. It is a means of enterprise management and at the same time a method of summarizing and presenting information about economic activity. In turn, reporting serves as the initial basis for subsequent planning.
The financial condition of an enterprise or balance sheet (form No. 1) is a set of indicators that reflect its ability to pay off its debt obligations. The most complete analysis of the financial activity of the enterprise can be carried out using financial ratios. For this analysis, the balance sheet is used. The balance reflects the financial condition of the enterprise. To establish what impact the external and internal conditions of the enterprise's activity had on the current situation, it is necessary to analyze the asset and liability of the balance sheet.
Vertical and horizontal analysis balance sheet is presented in tables 1 and 2.
As can be seen from Table 1, the value of the property of the enterprise (assets) in 2012. compared to 2011 increased by 772,151 thousand rubles. or by 6.32%., and compared with 2010. the increase occurred by 1235135 thousand rubles. or 10.50%. The increase in the value of property is associated with internal changes in the asset balance. With a decrease in the value of non-current assets by 12.81% or 584340 thousand rubles, there was an increase in current assets by 17.70% or 1356491 thousand rubles.
The decrease in the value of non-current assets is associated with a decrease in all key indicators, of which is a decrease in fixed assets by 1,431,475 thousand rubles. or 90.74% compared to 2011, and by 1,610,450 thousand rubles. or by 91.69% compared to 2010. A strong decrease is also observed in other non-current assets compared to 2011. the decrease amounted to 4422039 thousand rubles. or by 96.95%, and compared to 2010. 3375181 thousand rubles go to 96.05%. Financial investments decreased by 454615 thousand rubles. rub. or by 19.05% compared to 2011, and compared to 2010 there was an increase of 839989 thousand rubles. rub. or 76.97%. Since these assets do not participate in the production turnover, therefore, a decrease in their amount will have a positive effect on the performance of the financial activity of the enterprise.
Intangible assets decreased by 66 thousand rubles. or 0.60%, although compared with 2010 there is a significant increase of 9925 thousand rubles. or 991.39%. The decrease in intangible assets indicates the influence of the market, as well as an increase in current assets.
Deferred tax assets also decreased by 148,890 thousand rubles. or by 25.50% compared to 2011, and compared to 2010 by 226,176 thousand rubles. or 34.21%.
With a decrease in the cost of non-current assets, the main financing was directed to replenish working capital. The increase in current assets indicates the expansion of the enterprise.
There was an increase in stocks compared to 2011 by 991827 thous. rub. or by 21.54% compared to 2010 by 1,297,769 thousand rubles. or by 30.20%., this indicates an increase in production potential, protection of monetary assets from inflation.
The value added tax on acquired valuables increased by 51115 or 938.06%, this is due to the purchase of materials and stocks, and is a positive factor.
There was a decrease in accounts receivable in 2012 compared to 2011 by 6,227,324 thousand rubles. or by 42.02%, and compared to 2010, the decrease amounted to 665,189 thousand rubles. or by 43.45%. This indicates a positive trend in the organization, as the demand for products that were sent on credit increased, as well as the debt of buyers and customers decreased. This has a positive effect on the solvency of the organization and increases its financial stability.
Financial investments in 2012 compared to 2011 increased by 460,797 thousand rubles. or by 46.12%, although in comparison with 2010 there was a decrease of 385,931 thousand rubles. thousand roubles. This indicator indicates the financial activity of the enterprise, and indicates its financial activity and investment contributions.
An increase in 2012 compared to 2011 is also observed in cash and cash equivalents by 379,760 thousand rubles. or by 69.95%, compared with 2010 by 439430 or by 90.93%. This indicates a positive position of the organization and an increase in the liquidity of capital.
Based on the assessment of balance sheet assets, an increase in the production potential of the enterprise was revealed, despite the decrease in non-current assets, there is an increase in working capital, which is a positive trend.
The balance sheet liability increased by 772,151 thousand rubles. or by 6.32% compared to 2011, compared to 2010, the increase amounted to 1,235,135 thousand rubles. or 10.50%. This increase is due to an increase in capital and reserves by 216457 thousand. rub. or 6.85% in reporting year and an increase in long-term liabilities by 1,500,023 thousand rubles. or by 63.82%.
The increase in capital and reserves is associated with a decrease in the item uncovered loss 4.77% or 216457 thousand rubles. , but compared to 2010, there is an increase in losses in the amount of 859,093 thousand rubles. This indicates a decrease in its capital of the organization.
The authorized capital in 2010 was 158 thousand rubles. in 2011 there was an increase in the authorized capital due to the revaluation of fixed assets and amounted to 296 thousand rubles. In 2012, the authorized capital did not change.
Additional capital compared to 2011 remained unchanged, compared to 2010 it increased by 503,097 thousand rubles. or by 188.56% and amounted to 7698185 thousand rubles.
The reserve capital has not changed for three years and amounts to 8 thousand rubles.
The increase in long-term liabilities is mainly due to the increase borrowed money. In 2012, compared to 2011, an increase occurred by 1,500,000 or 63.83%, and compared to 2010, there is a decrease in borrowed funds by 1,418,419 thousand rubles. or by 26.92%. This indicates a lack of own working capital and, as a result, the financial dependence of the enterprise on external sources, but because it is used to cover costs and these funds can be equated to equity, this does not worsen the financial condition and stability of the organization. A decrease in long-term liabilities along with an increase in short-term liabilities can lead to a deterioration in the financial stability of an enterprise, but the enterprise is experiencing a decrease in short-term liabilities.
Short-term liabilities decreased by 944329 thousand rubles. or by 14.06%, but this caused a decrease in the balance sheet liability and did not affect the overall growth trend.
The decrease in short-term liabilities was associated with a decrease in borrowed funds by 1,226,248 thousand rubles. or by 92.63% compared to 2011, compared to 2010, the decrease amounted to 2342462 thousand rubles. or 96.00%. This refers to the repayment of short-term loans.
An increase in the section of short-term liabilities is observed in terms of accounts payable and estimated liabilities.
Accounts payable increased by 258351 thousand rubles. or 4.88% compared to 2011. Compared to 2010, the increase in accounts payable increased by 705,241 thousand rubles. or by 14.55%. it all speaks of debt to suppliers, contractors, personnel and other creditors. The presence of accounts payable is not a favorable factor for the organization and reduces the indicators of the financial condition of the enterprise, solvency and liquidity.
Based on the analysis of balance sheet liabilities, an increase in capital and reserves due to retained earnings was revealed, which is a positive moment in the work of the enterprise. Also a positive point is the reduction of short-term liabilities, this is due to the repayment of short-term loans. However, there is also an increase in accounts payable, this is a negative moment in the work of the enterprise. Also, there is an increase in long-term liabilities at the expense of borrowed funds, this may be due to the taking of long-term loans, these funds, based on the analysis of the balance sheet asset, could be spent on increasing the fixed assets of the enterprise.
Thus, the analysis of the company's balance sheet showed that OJSC "Children's World Center" tends to develop, at the expense of free cash and borrowed funds, to expand the scope of activities and increase profits.
Table 1
Horizontal analysis of JSC "Children's World-Center" for 2012-2010
|
Name of indicator |
Absolute deviation of 2012 from 2011, thousand rubles |
Absolute deviation of 2012 from 2010 in thousand rubles |
Growth rate 2012 to 2011 in % |
Growth rate 2012 to 2010 in % |
|||
|
ASSETS | |||||||
|
I. Non-current assets | |||||||
|
Intangible assets | |||||||
|
fixed assets | |||||||
|
Financial investments | |||||||
|
Deferred tax assets | |||||||
|
Other noncurrent assets | |||||||
|
Total for Section I | |||||||
|
II. current assets | |||||||
|
Accounts receivable | |||||||
|
Other current assets | |||||||
|
Total for Section II | |||||||
|
BALANCE |
12997701 |
12225550 |
11762566 | ||||
|
Passive | |||||||
|
III. Capital and reserves | |||||||
|
Reserve capital | |||||||
|
Total for Section III | |||||||
|
IV. Long term commitment | |||||||
|
Borrowed funds | |||||||
|
Total for section IV | |||||||
|
V. Short-term liabilities | |||||||
|
Borrowed funds | |||||||
|
Accounts payable | |||||||
|
Estimated liabilities | |||||||
|
Section V total | |||||||
|
BALANCE |
12997701 |
11762566 |
table 2
Vertical analysis of the balance sheet of OAO Detsky Mir-Center for 2012-2010
|
Name of indicator |
Deviation, in percentage points 2012 by 2011 |
Deviation, in percentage points 2012 by 2010 |
||||||
|
thousand roubles. |
in % of the total balance |
thousand roubles. |
in % of the total balance |
thousand roubles. |
in % of the total balance |
|||
|
ASSETS | ||||||||
|
I. Non-current assets |
||||||||
|
Intangible assets | ||||||||
|
fixed assets | ||||||||
|
Financial investments | ||||||||
|
Deferred tax assets | ||||||||
|
Other noncurrent assets | ||||||||
|
Total for Section I | ||||||||
|
II. current assets | ||||||||
|
Value added tax on acquired valuables | ||||||||
|
Accounts receivable | ||||||||
|
Financial investments (excluding cash equivalents) | ||||||||
|
Cash and cash equivalents | ||||||||
|
Other current assets | ||||||||
|
Total for Section II | ||||||||
|
BALANCE |
12997701 |
12225550 |
11762566 | |||||
|
LIABILITY | ||||||||
|
III. Capital and reserves |
||||||||
|
Authorized capital (share capital, authorized fund, contributions of comrades) | ||||||||
|
Revaluation of non-current assets | ||||||||
|
Additional capital (without revaluation) | ||||||||
|
Reserve capital | ||||||||
|
Retained earnings (uncovered loss) | ||||||||
|
Total for Section III | ||||||||
|
IV. long term duties | ||||||||
|
Borrowed funds | ||||||||
|
Deferred tax liabilities | ||||||||
|
Total for section IV | ||||||||
|
V. Current liabilities | ||||||||
|
Borrowed funds | ||||||||
|
Accounts payable | ||||||||
|
Estimated liabilities | ||||||||
|
Section V total | ||||||||
|
BALANCE |
12997701 |
12225550 |
11762566 | |||||
According to Table 2, we can say that the largest change in the share occurred in terms of net profit by 6.59 percentage points, this increase was due to an increase in profit before tax by 6.88 percentage points. and a decrease in other expenses by 7.95 percentage points. The increase in profit before tax is due to a decrease in interest payable by 1.57 percentage points. and an increase in income from participation in other organizations by 0.11 percentage points. An increase in other income by 0.64 percentage points. had no significant impact on profit growth. The increase in profit before tax was influenced by a decrease in the share of other expenses by 7.95 p.p. The decrease in the share of profit from sales was due to an increase in commercial expenses by 0.38 percentage points, while management expenses, on the contrary, contributed to an increase in the share by 0.31 percentage points. respectively. The decline in gross profit by 3.28 percentage points also contributed to the share of profit from sales. The share of gross profit decreased due to an increase in the share of cost of sales by 3.28 percentage points.
Based on the foregoing, it can be concluded that the proportion net profit is associated with an increase in the share of almost all the company's income, profit before tax and a decrease in some of the company's expenses and interest payable
To analyze the main performance indicators of the enterprise, we use the data of the income statement (form No. 2). The report is a form financial statements, the main purpose, which is to characterize the financial results of the organization for the reporting period.
To analyze the composition of profit and its dynamics, we will carry out a horizontal and vertical analysis of the profit and loss statement of the organization OJSC Detsky Mir-Center. The analyzes are presented in tables 2 and 3. The purpose of the horizontal and vertical analysis is to provide a visual representation of the changes that have occurred in the main line items of the income statement.
Table 3
Horizontal Analysis of the Profit and Loss Statement
OJSC "Children's World-Center"
|
Name of indicator |
For January - December 2011, thousand rubles |
Absolute deviation, thousand rubles |
Growth rate, % |
Growth rate, % |
|
|
Revenue | |||||
|
Cost of sales | |||||
|
Gross profit | |||||
|
Selling expenses | |||||
|
Management expenses | |||||
|
Profit (loss) from sales | |||||
|
Interest receivable | |||||
|
Percentage to be paid | |||||
|
Other income | |||||
|
Other expenses | |||||
|
Net income (loss) |
Analysis of table 3 showed that net profit increased by 1,333,890 thousand rubles. or by 118.2% compared to 2011, in which significant losses were observed. This increase is due to an increase in profit before tax by RUB 1,416,848 thousand. or by 137.4%. The increase in income tax and other similar payments by 82,958 thousand rubles negatively affects net profit. or 85.6% compared to the previous year.
Profit before tax increased due to the growth of income from participation in other organizations by 28,840 thousand rubles. by 158.5% compared to 2011, in which there were losses, and interest receivable by 15,796 thousand rubles. or 9.1%. Also, this increase is associated with a decrease in other expenses by 1,419,198 thousand rubles. rub. or by 55.6% compared to the previous year and with a decrease in interest payable by 271,631 thousand rubles. rub. or by 48.4%.
Increase in other income by 335,509 thousand rubles. or by 28.6% served as an increase in profit before tax by 1,416,848 thousand rubles. or 137.4%.
Gross profit compared to 2011 increased by 474,612 thousand rubles. or by 6.2%, despite this, administrative expenses also increased by 105,347 thousand rubles. or by 9.5%, this was due to an increase in the cost of maintenance and rent for premises for general purposes, and commercial expenses by 1,023,391 thousand. rub. or 17.5%, this was due to an increase in the cost of shipping and selling products, which led to a drop in sales profit. As a result, sales profit decreased by 90.9% compared to 2011 and amounted to 654,126 thousand rubles.
The increase in gross profit is associated with an increase in revenue by 3,177,957 thousand rubles. or 16%. Increase in cost of sales by 2,703,345 thous. rub. or 22.3% resulted in an increase in gross profit.
At the end of the year, net profit was received in the amount of 205,642 thousand rubles, and compared to 2011, losses were observed in the amount of 1,128,248.
After analyzing table 3, we can conclude that JSC Detsky Mir-Center has a tendency to develop, because there is an increase in net profit, which is associated with an increase in most indicators of the company's income and a decrease in some indicators of the company's expenses.
The main result of 2012 was an increase in efficiency and financial stability, the development of the network was fully financed from the organization's own funds, operating cash flow reached a historic high, and net debt decreased significantly compared to the previous year.
The growth in indicators is due to an increase in sales volumes associated with the introduction of new distribution channels for products and the introduction of online trading.
According to the profit and loss statement, it is also possible to conduct a vertical analysis, i.e. consider the profit structure, the elements of which are defined as a percentage of sales revenue. Vertical analysis is presented in Table 4.
Table 4
Vertical analysis of the income statement
OAO Detsky Mir-Center
|
Name of indicator |
For January - December 2012, thousand rubles |
Share of 2012, % |
For January - December 2011, thousand rubles |
Share of 2011, % |
Change, % |
|
Revenue | |||||
|
Cost of sales | |||||
|
Gross profit | |||||
|
Selling expenses | |||||
|
Management expenses | |||||
|
Profit (loss) from sales | |||||
|
Income from participation in other organizations | |||||
|
Interest receivable | |||||
|
Percentage to be paid | |||||
|
Other income | |||||
|
Other expenses | |||||
|
Profit (loss) before tax | |||||
|
Income tax and other similar payments | |||||
|
Net income (loss) |
According to Table 4, we can say that the largest change in the share occurred in terms of net profit by 6.59 percentage points, this increase was due to an increase in profit before tax by 6.88 percentage points. and a decrease in other expenses by 7.95 percentage points. The increase in profit before tax is due to a decrease in interest payable by 1.57 percentage points. and an increase in income from participation in other organizations by 0.11 percentage points. An increase in other income by 0.64 percentage points. had no significant impact on profit growth. The increase in profit before tax was influenced by a decrease in the share of other expenses by 7.95 p.p. The decrease in the share of profit from sales was due to an increase in commercial expenses by 0.38 percentage points, while management expenses, on the contrary, contributed to an increase in the share by 0.31 percentage points. respectively. Also, the decline in gross profit by 3.28 p.p. contributed to the share of profit from sales. The share of gross profit decreased due to the increase in the share of cost of sales by 3.28 percentage points.
Based on the foregoing, we can conclude that the share of net profit is associated with an increase in the share of almost all the company's income, profit before tax and a decrease in some of the company's expenses and interest payable.
If you need to get rid of short term loans or at least reduce their share, you should use the recommendations below. They will tell you what debts to start with, how to try to do without new loans and how to negotiate a restructuring.
To cut short-term borrowings in times of crisis, you need to:
- rank all liabilities up to one year in terms of maturity;
- select sources for payment of urgent debts;
- agree to renegotiate the terms of loans and credits.
How to rank a company's short-term debt obligations by maturity
To reduce the share short term loans need:
- analyze the terms of each individual contract (agreement);
- break down all debt into several categories (on the effectiveness of debt management, see).
For example, in the first category, include debts for which the payment period cannot be transferred - urgent (for example, from). In the second - contracts, the repayment of which can be delayed a little (for example, with, which can wait with payment). If there are many such contracts, there may be several queues.
How to choose sources of repayment of short-term obligations in a crisis
When choosing sources of repayment of current liabilities, it is important to take into account all possible risks, including the threat of falling. That is why, in a crisis, it is better to immediately exclude the option of attracting loans from the list. In practice, the choice of such a method of financing often becomes the reason.
We will have to limit ourselves to the internal resources of the company. To begin with, it is worth holding a continuous line of all property (for more details, see). From the received assets, choose assets that can be sold without the risk of a complete cessation or suspension of the main activity. This will free up money to pay off debts and save money at the same time.
In addition, it is necessary to determine the feasibility of using buildings, structures, land plots located on . Real estate objects that are not involved in the main activity of the enterprise (or objects whose disposal will not lead to a stop in production) cost p. It is worth noting that the proceeds from the sale, as well as objects involved in unprofitable production (closed in accordance with), can be used to pay off short-term obligations only after payment.
The question of the sale of objects of construction in progress deserves special attention (for more details on when this is justified, see). It would also be useful to consider the possibility of prompt collection or sale of receivables, and direct the proceeds to pay loans and credits (for more details, see and). A tangible amount can be obtained from the sale of surplus stocks identified during the inventory. By the way, if you have short-term financial investments, they should be cashed out in a crisis.
How to achieve a revision of the terms of financing for attracted short-term loans and borrowings
In a crisis, reduce the share short term loans it is possible by replacing them with long-term ones (that is, by transferring from the fifth section of the balance to the fourth). To do this, for example, enter .
In effect, this means that the CFO will have to slightly increase the total amount of debt, but also reschedule loans and lower monthly payments.
Formula. Calculation of the share of overdue accounts payable in liabilities
This decision will reduce the current expenses of the enterprise, as well as level the risk that one of the creditor banks will file an application for declaring the enterprise bankrupt, especially if the share of overdue accounts payable is growing (how to prevent this, see).