Let us consider the models of bankruptcy of an enterprise, and in more detail methods for assessing the solvency of an enterprise.
What is a scoring model for enterprise valuation?
The scoring approach to assessing the solvency of an enterprise consists in analyzing statistics on enterprises on their fulfillment of obligations to creditors, information about which is contained in the credit history bureau. Therefore, scoring models are sometimes referred to in the literature as credit scoring models ( credit-score) or credit scoring models. Thus, we can say that credit scoring models are statistical models for assessing the solvency of an enterprise.
History of the scoring approach to evaluation
Previously, scoring models were developed solely to assess the creditworthiness of individuals for the purpose of issuing loans by banks. This approach was first proposed by D. Duran in 1941 to classify bank customers into two classes: creditworthy and non-creditworthy. To determine the class, indicators were calculated to make a conclusion about its risk of bankruptcy. Scores for scoring models are calculated using the logistic regression tool. On its basis, by the way, logit-models for assessing the risk of bankruptcy of individuals and enterprises are also built.
The task of the scoring approach for assessing the solvency of an enterprise
The task of the scoring model for assessing the solvency of an enterprise is to classify it according to the degree of financial risk. The scoring approach is similar to the rating approach for assessing an enterprise, since it also has a rating (class) for an enterprise, in addition to this, there is a scoring and assigning a rating to financial indicators.
The difference lies in the fact that as a result a rating is assigned and the company belongs to the solvency class, i.e. In addition to evaluation, classification is also carried out. Also, as a result of scoring, a rating is obtained for the enterprise and a rating for financial ratios describing the enterprise.
Scoring models for assessing the solvency of an enterprise
Consider domestic scoring models for assessing the solvency of an enterprise. Let us analyze two domestic scoring models by Dontsova-Nikiforova and Savitskaya. These models are designed to assess the risk of bankruptcy of domestic enterprises. So, let's begin.
Scoring model of Dontsova-Nikiforova (1999)
Dontsova L.V.
Economists Dontsova L.V. and Nikiforova N.A. offer a scoring model for assessing the solvency of an enterprise, which allows the company to be assigned to one of the six classes of solvency, based on the assessment of six financial ratios.
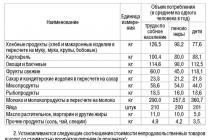
| Index | 1 class(score) | Grade 2(score) | 3rd grade(score) | 4th grade(score) | 5th grade(score) | 6th grade(score) |
| Absolute liquidity ratio | 0.25 and more (20) | 0.216 | 0.15(12) | 0.1(8) | 0.05(4) | Less than 0.05(0) |
| Quick liquidity ratio | 1 or more(18) | 0.9(15) | 0.8 (12) |
0.7(9) | 0.6(6) | Less than 0.5(0) |
| 2 or more(16.5) | 1.7(120 | 1.4(7.5) | 1.1(3) | 1(1.5) | Under 1(0) | |
| 0.6 and more(17) | 0.54(12) | 0.43(7.4) | 0.41(1.8) | 0.4(1) | Less than 0.4(0) | |
| Working capital ratio | 0.5 and more(15) | 0.4(12) | 0.3(9) | 0.2(6) | 0.1(3) | Less than 0.1(0) |
| Reserves coverage ratio | 1 or more(15) | 0.9(12) | 0.8(9) | 0.7(6) | 0.6(3) | Less than 0.6(0) |
| The minimum value of the border in points | 100 | 64 | 50 | 28 | 18 | – |
| Grade 1>100 points | The company has a good margin of financial strength | |||||
| Grade 2>64 points | The company has an insignificant probability of paying off debts, in general, there is a risk | |||||
| Grade 3>50 points | Troubled Enterprise | |||||
| Grade 4>28 points | The company has a high risk of bankruptcy | |||||
| Grade 5>18 points | The company has a very high risk of bankruptcy, recovery measures are unlikely to help | |||||
| 6th grade<18 баллов | The company is financially insolvent | |||||
Note:
In the valuation model, the main emphasis is on liquidity ratios (, quick liquidity ratio, absolute liquidity ratio), as well as on turnover ratios (equity ratio, inventory ratio).
| Odds | Formula | Calculation |
|
Absolute liquidity ratio |
(Cash + Short-term financial investments) / Short-term liabilities | p.1250 / (str.1510+str.1520) |
|
Quick liquidity ratio |
(Current Assets - Inventories) / Current Liabilities | (p.1250+p.1240) / (p.1510+ p.1520) |
|
Current liquidity ratio |
||
|
Financial Independence Ratio |
Equity/ Assets | p.1300 / p.1600 |
|
Working capital ratio |
(Equity - Non-current assets) / Current assets | (p.1300-p.1100) / p.1200 |
|
Reserves coverage ratio |
Inventory turnover ratio= Sales revenue / Average inventory | p.2110 / (p.1210 np.+p.1210 kp.)*0.5 |
n.p. and k.p. - the value of the balance line at the beginning of the period and the end of the period, respectively.
Savitskaya scoring model (2007)

Savitskaya G.V.
Professor G.V. Savitskaya offers her own scoring credit model for assessing the financial condition of an enterprise. The difference lies in the fact that in the model the enterprise is classified according to five classes and three financial ratios are used for this.
| Index | 1 class | Grade 2 | 3rd grade | 4th grade | 5th grade |
| Return on total capital, % | 30 and above (50 points) | 29.9-20(49.9-35 points) | 19.9-10(34.9-20 points) | 9.9-1(19.9-5 points) | Less than 1(0 points) |
| Current liquidity ratio | 2 or more (30 points) | 1.99-1.7(29.9-20 points) | 1.69-1.4(19.9-10 points) | 1.39-1.1(9.9-1) | 1 and below (0 points) |
| 0.7 or more (20 points) | 0.69-0.45(19.9-10 points) | 0.44-0.3(9.9-5 points) | 0.29-0.2(4.9-1 points) | Less than 0.2(0 points) | |
| Class boundaries | 100 points | 99-65 | 64-35 | 34-6 | 0 points |
| Grade 1>100 points | An enterprise with good financial strength | ||||
| Grade 265-99 points | The company has a small risk of non-repayment of debts | ||||
| Grade 335-64 points | Troubled Enterprise | ||||
| Grade 46-34 points | The company has a high risk of bankruptcy. Lenders risk losing their invested funds | ||||
| Grade 50 points | The enterprise is insolvent | ||||
Note:
Two of the three financial ratios determine the solvency of the enterprise, where the current liquidity ratio determines the short-term liquidity, and the financial independence ratio determines the long-term liquidity of the enterprise.
Financial independence ratio = autonomy ratio.
Calculation of financial ratios in the scoring model
| Odds | Formula | Calculation |
|
Return on total capital |
Profit before tax / Liabilities | p.2300 / p.1700 |
|
Current liquidity ratio |
Current assets / Current liabilities | p.1200 / (p.1510+p.1520) |
|
Financial Independence Ratio |
Equity / Assets | p.1300 / p.1600 |
Summary
Let us sum up the analysis of credit scoring models for assessing the solvency of an enterprise. One of the indisputable advantages is that these models were developed for domestic enterprises. One of the difficulties in estimating using such models is the large complexity of the calculations and often the incomprehensibility in using the scoring of financial ratios. Their use is well combined with other methods of assessing the financial condition.
Thank you for your attention! Good luck!
Customer evaluation system based on statistical methods. As a rule, this computer program, where the data of a potential borrower are entered. In response, a result is issued - is it worth it to provide him with a loan. The name scoring comes from the English word score, that is, "score".
There are four types of scoring:
- application-scoring (literal translation from English - “scoring of applications, appeals”) - an assessment of the creditworthiness of borrowers when issuing a loan. This is the most common type of scoring known to customers. It is based on the primary collection of the borrower's personal data, their processing by a computer and the conclusion of the result: to grant a loan or not;
- collection-scoring - scoring system at the stage of work with bad loans. Determines the priority actions of bank employees to repay "bad" loans. In fact, the program allows you to take a number of steps to deal with bad debts, for example, from an initial warning to referring the case to a collection agency. It is believed that in the course of such processing, about 40% of clients refer to forgetfulness and repay the loan;
- behavioral-scoring, “behavior scoring” - an assessment of the most likely financial actions of the borrower. Such a system makes it possible to predict changes in the solvency of the borrower, adjust the limits set for him. The basis of the analysis can be the actions of the client for certain period, such as credit card transactions ;
- fraud-scoring is a statistical assessment of the likelihood of fraudulent actions by a potential borrower. Such scoring is usually used in conjunction with other types of customer research. At the same time, it is believed that up to 10% of loan defaults in Russia are associated with outright fraud, and this figure is growing.
Many scoring systems not only process the entered data, but are also capable of self-learning: they take into account the behavior of already accepted clients in order to adjust their assessment of future borrowers.
There are ready-made solutions on the banking software market. The most famous Western programs are SAS Credit Scoring, EGAR Scoring, Transact SM (Experian-Scorex), K4Loans (KXEN), Clementine (SPSS). Among the Russian developers, Basegroup Labs, Diasoft stand out, and the Ukrainian company Neuro-Systems Business is well-known. At the same time, many banks are developing their own systems.
Scoring systems allow reducing costs and minimizing operational risk by automating decision making, reducing the processing time for loan applications, enabling banks to conduct their credit policy centrally, and provide additional protection for financial institutions from fraud. At the same time, scoring also has a number of disadvantages: often the system's decision is based on the analysis of data provided exclusively by the borrower. In addition, scoring systems need to be constantly improved and maintained, since they take into account only past experience and react to changes in the socio-economic situation with a delay.
When issuing loans, banks seek to maximize profits and guarantee the return of funds transferred to the borrower. In order to reduce the risk of delays, financial institutions carefully analyze all applicants and approve only applications, the obligations of which will be fulfilled with a high probability.
The assessment of the creditworthiness of a borrower - an individual is often carried out using (from English scoring - "scoring"). The scoring model analyzes the factors that influence the risk of loan default and provides recommendations for approval or rejection of the application. When applying for a loan, the borrower is first asked to fill out a questionnaire. It is on the basis of these data that the assessment is made. For each parameter, the client receives a certain number of points, there are increasing and decreasing coefficients. The final result was previously calculated manually bank employees, today this is done automatically in special programs.
Where is scoring applied?
The scoring model is widely used in the field of microfinance and express lending, where reviewing the data of a potential borrower and making a decision takes less than 1 hour. To check creditworthiness, information from a completed application is entered into a special program. The system automatically compares the data provided by the potential borrower with statistics. So, if the database contains information that people of the same age or profession often do not repay the loan, then the decision on the application may be negative. In such cases, a bank or microfinance organization usually refuses a potential borrower without explanation.
Benefits of the CREDIT SCORE SCORING SYSTEM
Decision making speed. If a bank employee analyzes the solvency of the borrower, this will take a lot of time. The specialist needs to independently check each parameter, manually enter all the results obtained and draw a conclusion. With the help of modern scoring systems for assessing creditworthiness, data is processed quickly, which means that a decision is made promptly.
Objectivity. Even an experienced and qualified specialist can make a mistake in the calculations or form a biased opinion due to a personal attitude towards the client. The score is a much more objective indicator of creditworthiness because it is calculated automatically. A bank employee cannot influence the operation of the algorithm.
Financial benefit. The use of a scoring model for assessing creditworthiness can significantly reduce the share of default. This not only increases the bank's profits, but also enables it to offer better rates to customers. The level of default directly affects the interest on loans, so conscientious payers are also interested in reducing it.
What determines the results of scoring
The final assessment when using any scoring model consists of a number of indicators. First of all, the passport details of the borrower, information about the place of residence and other contact details are checked. This is a preliminary stage at which applicants with invalid documents are screened out. Then there is the analysis of other factors.
- Personal information about the client. The scoring assessment takes into account the marital status of the borrower and the presence of minor children. The length of service at the last place of work is also taken into account.
- Applicant's solvency. One of the most significant factors influencing the scoring score. To get approval, it is important to prove that you have not only sufficient funds to repay the loan, but also regular payments. For rate financial position and creditworthiness in most cases (especially when issuing large loans) it is required to provide documents from the place of work: a 2-NDFL certificate or in the form of a bank. Sometimes the expenses of the applicant are also taken into account (for the maintenance of dependents, utilities etc.).
- Credit history. When scoring the creditworthiness of customers, it is mandatory to check debts and delinquency on previously taken loans. The Bank may, if consented to, obtain data on the applicant from the credit history bureau (BKI), which reflects all the necessary information. The system also takes into account the presence or absence of regular payments on existing loans. The BCI records the history of applications made by the applicant: the presence of a large percentage of refusals from other financial institutions may reduce the assessment.
- transactional behavior. If the borrower is a payroll client or has a bank deposit, the credit score may be increased. This takes into account the amount of savings on the account and their dynamics.
The scoring system checks all data separately and compares them with each other in order to identify possible contradictions. The reliability of the specified information is confirmed by the existence of a connection between the income and expenses of a potential borrower, place of work and address of residence, etc.
Analysis of scoring data
Based on the result, the system makes a decision:
- OK- the score is high, the application can be transferred to the next level;
- refusal- the applicant scored too low a score, so the consideration of the request is terminated;
- additional analysis required– the system does not have enough data to give an adequate assessment. In this case, the bank specialist independently studies the applicant's questionnaire and clarifies the information. To confirm the controversial aspects, the applicant may be required to provide additional documents. After a manual review of the application, a final decision is made.
How to get a high score
Avoid loan arrears. To increase the chances of a good assessment and approval of the application, you need to have a clean credit history. This means that the applicant must not be in arrears on other loans or outstanding debts. Therefore, even if financial difficulties arise, it is important to monitor your credit history. It is better to provide the bank with documentary evidence of temporary insolvency in time and develop a debt restructuring or deferral scheme. This will close the current loan and increase the likelihood of approval of a new one.
Open a bank account. In most banks, you can get additional scoring points if you have an account, so it is better to make a deposit in advance.
Indicate only real information in the application. The accuracy in filling out the questionnaire also affects the assessment. The information must be objective and truthful: doubts about the accuracy of the information may be the reason for refusing a loan.
Pay attention to the relevance of contacts in the questionnaire. In order to increase the scoring assessment of creditworthiness, it is necessary to indicate only real contact details in the questionnaire. A bank employee should be able to call all subscribers whose phones have been entered by a potential borrower. If it is not possible to contact them, the specified data may be considered unreliable. This is one of the reasons to refuse credit.
If the score turned out to be too low and the application was rejected, this may indicate that the model and algorithm of a particular bank are not suitable for the borrower. Financial institutions often use their own systems, which take into account a different set of factors.
What to do in case of refusal
With a low score, the system usually simply rejects the application, while the client is not informed of the reasons for such a decision. Bank employees often recommend repeating the appeal after a few months. Alternatively, you can try applying to another financial institution. However, this should be done with caution: all refusals are recorded in the credit history, and if there are too many, the score is reduced. In order to find out about the presence and number of rejected applications even before contacting the bank, you can send a request to the CBI.
The scoring model does not provide objective and relevant results if the client is applying for a loan for the first time. For such cases, some banks use only manual processing of applications by specialists. At the same time, in fact, such clients are often offered less favorable conditions, increased interest rates and reduced loan amount. So the bank reduces losses from a possible default. However, if you repay the first loan on time and without delay, this will be reflected in your credit history, so the next time you can count on a higher rating.
To use the services of the NBKI for the development and/or use of scoring system methods, fill out the application form on the website.
Dubovitsky V. S.
major analyst Russian bank
(Moscow city)
Corporate Finance Management
05 (65) 2014
This article describes a study on the development of a scoring model for assessing the creditworthiness of large trading enterprises, which makes it possible, based on the values of individual indicators, to judge the solvency of the borrower and evaluate its effectiveness. The most voluminous blocks in the development of a scoring model are the choice of a system of evaluation indicators and the determination of weighting factors for these indicators, which will be covered in detail in this article.
INTRODUCTION
One of the key areas of business in the banking sector is lending. Credits are the basis banking assets providing the bank with interest income. Recently, there has been a rapid development in our country banking sector, especially credit relations of banks with the population, entrepreneurs and large businesses. Loans involve not only interest income, but also credit risks associated with the insolvency of the borrower and the loss of the loan. Credit risk assessment is a key area of analysis when making a decision on lending to a particular borrower, and the well-being of a financial institution largely depends on it.
Nowadays, banks use various methods of analysis, assessing the level of possible losses and the probability of default by the borrower. Based on this analysis, the borrower is assigned a quality rating - “good”, “medium” or “poor”, in accordance with the Regulation of the Central Bank of the Russian Federation No. 254-p “On the procedure for forming credit institutions provisions for possible losses on loans, on loan and equivalent debt” dated March 26, 2004.
The Central Bank acts as the main regulator of the credit system and makes recommendations on assessing the creditworthiness of borrowers. In accordance with them, banks build their own valuation models - their diversity and ingenuity of their authors are amazing. Such models include comprehensive assessment financial condition of the borrower as the main indicator of future solvency. However, all models are aimed at the borrower's credit rating, which describes the level of risk of financial loss. According to the generally accepted classification, a good level of creditworthiness corresponds to a good financial condition of the company and a low risk of possible losses, medium - to an average financial condition and medium risks, bad - to a high probability of default by the borrower. In good condition, most likely, a positive decision will be made on issuing a loan, the average will require additional research, and a bad borrower will be denied.
Credit risk assessment in banks has always occupied a significant position. Thus, according to research by Bailey and Gately, existing valuation methods are constantly being improved, from time to time new methods appear, such as valuation using neural networks, which is caused by high demand from credit institutions to optimize and improve the predictive ability of tools for assessing the probability of default. potential borrowers.
So, creditworthiness assessment is a key task when issuing a loan. The purpose of this work is to create our own scoring model for assessing the credit quality of legal entities. It will be developed for large retailers and will allow to quickly decide on the feasibility of financing various borrowers.
First, a brief comparative analysis of existing approaches to assessing creditworthiness will be made. On its basis, arguments will be given in favor of developing a scoring model, then a scoring model will be directly developed using various theoretical methods. One of the main tasks in the development is the definition of a balanced scorecard based on the selected industry and the definition of weighting factors for these indicators.
Next, a statistical study will be carried out on the basis of a sample of 41 merchants (for 16 of them defaulted) in order to compare the results by indicator weights with the results obtained initially. Based on the results of the comparison, a conclusion will be given on the correctness of the compiled scoring model. At the end of this article, an assessment of the effectiveness of the developed model will be presented, the predictive ability of the developed model will be determined, and a conclusion will be made about its viability.
DIFFERENT APPROACHES TO ASSESSING CREDIT
All existing models borrowers' creditworthiness assessments can be presented in the form of the following classification (Fig. 1).
So, the variety of approaches to the analysis of creditworthiness can be systematized by dividing all methods into three large blocks:
- quantitative models;
- predictive models;
- quality models.
Quantitative models use the relevant indicators and allow assigning a certain rating to the borrower based on them, predictive models are based on past statistics and are aimed at modeling further developments and the borrower's default probability, and qualitative models use a system of versatile qualitative indicators.
To determine the most effective approach to assessing creditworthiness, we compare the described assessment methods. In table. 1 shows the comparative characteristics of the previously considered loan assessment models.
Table 1. Summary table of credit rating models
| Model name | Advantages of the model | Model Disadvantages |
| Coefficient method | Allows you to comprehensively assess the financial condition of the borrower | Does not take into account quality indicators, statistics of previous years. A non-automated system requires constant interpretation of the values of individual indicators |
| Rating Models | Allow to automate the assessment by the method of coefficients by calculating the integral indicator. Differ in convenience and ease of use | They take into account only financial indicators, do not use statistics from previous years. Require restructuring for different types of companies |
| Scoring models | They allow you to get an assessment of creditworthiness in a point equivalent and assign the borrower to one of three groups. Simple and easy to use, help to evaluate non-financial quality indicators. When assessing weight coefficients by statistical methods, they allow taking into account data on loans already issued, are economically justified | Not universal, require restructuring for certain types of companies. Requires a large amount of data to study the weighting coefficients |
| Cash flow models | Allows you to estimate the future cash flows of the company and compare them with the debt load | They do not take into account market conditions and quality indicators of the borrowing company. May produce inconsistent results |
| Discriminant Analysis Models | Allow to determine the probability of default of the borrowing company based on statistics for previous years | |
| Regression Models | They allow to determine the probability of default of the borrowing company based on the statistics of previous years. When using the model on the correct data, you can get results with a high degree of certainty | Purely empirical, the results are highly dependent on the training sample and when studying the model on other data, they often do not correspond to reality. Requires a large amount of data to study the weighting coefficients |
| Qualitative Analysis Models | Allows you to conduct a comprehensive analysis of the company | The absence of mathematical methods, leading to a subjective assessment of individual indicators and errors associated with the human factor. Do not take into account the statistics of previous years. There are no clear regulations for assessing creditworthiness for quality blocks of analysis |
Based on the above comparative analysis, we can conclude that the scoring model is at the top of the quantitative evolution. Name of the model Advantages of the model Disadvantages of the model
Ratio method Allows for a comprehensive assessment of the financial condition of the borrower Does not take into account quality indicators, statistics of previous years. A non-automated system requires constant interpretation of the values of individual indicators
Rating models Allow to automate the assessment by the coefficient method by calculating the integral indicator. They are distinguished by convenience and ease of use. They take into account only financial indicators, do not use statistics from previous years. Require restructuring for different types of companies
Scoring models Allow to obtain an assessment of creditworthiness in a point equivalent and assign the borrower to one of three groups. Simple and easy to use, help to evaluate non-financial quality indicators. When evaluating weight coefficients by statistical methods, they allow taking into account data on loans already issued, are economically justified Not universal, require restructuring for certain types of companies. Requires a large amount of data to study the weighting coefficients
Cash Flow Models Allow to estimate the company's future cash flows and compare them with the debt load Does not take into account market conditions and quality indicators of the borrowing company. May produce inconsistent results
Discriminant analysis models Allow to determine the probability of default of the borrower company on the basis of statistics for past years. Purely empirical, the results are highly dependent on the training sample and when studying the model on other data, they often do not correspond to reality. Requires a large amount of data to study the weighting coefficients
Regression analysis models Allow to determine the probability of default of the borrowing company based on the statistics of previous years. When using the model on the correct data, you can get results of a high degree of reliability. These are purely empirical, the results are highly dependent on the training set, and when studying the model on other data, they often do not correspond to reality. Requires a large amount of data to study the weighting coefficients
Qualitative analysis models Allow for a comprehensive analysis of the company Absence of mathematical methods, leading to a subjective assessment of individual indicators and errors associated with the human factor. Do not take into account the statistics of previous years. There are no clear regulations for assessing creditworthiness for qualitative blocks of analysis with a different number of points. The values of the coefficients will be further divided into ranges. For each range (Coefficient Range column in Table 2), a percentage (25%, 50%, 75%, or 100%) of the weighting coefficient in Table 2 will be set. 2. The weighting factor in this case is the maximum score. In the following, we will focus on the search for weight coefficients. Thus, the breakdown of coefficients into ranges is conditional (based on logical considerations based on the values of these indicators for various companies industries; the intervals are taken in such a way that about 60% of the leading companies of the industry (Magnit, Dixy, X5 Retail Group, OK, L "Etoile"), selected to determine the average market coefficients and benchmarks, fall into the second interval after the maximum) .The higher debt load, the higher the probability of default and the lower the number of points the indicator should receive. Empirical methods are focused on the search for weight coefficients and will be represented by two approaches - analytical (T. Saati method) and statistical (regression study) (the maximum number of points in this case coincides with the weight coefficient). The weighting coefficients themselves will be determined later.
The financial indicators of the scoring model are presented in Table. 2.
Table 2. Financial indicators of the scoring model
| Indicator group | Index | Coefficient range | |
| Liquidity | > 0,75 | 1 | |
| 0,5-0,75 | 0,75 | ||
| 0,25-0,5 | 0,25 | ||
| 0-0,25 | 0 | ||
| Solvency | 0-1 | 1 | |
| 1-1,5 | 0,75 | ||
| 1,5-2 | 0,5 | ||
| 2-2,5 | 0,25 | ||
| > 2,5 | 0 | ||
| < 1,5 | 1 | ||
| 1,5-2 | 0,5 | ||
| > 2 | 0 | ||
| Interest coverage ratio, EBIT/Interest | > 1,5 | 1 | |
| 1,3-1,5 | 0,75 | ||
| 1-13 | 0,5 | ||
| < 1 | 0 | ||
| Business activity | Return on sales, ROS | > 0,025 | 1 |
| 0,02-0,025 | 0,75 | ||
| 0,015-0,02 | 0,5 | ||
| < 0,015 | 0 | ||
| Company's loss for the last three reporting periods | Not | 1 | |
| For one reporting period | 0,5 | ||
| 0 |
Permissible ratio values were determined on the basis of average values for the five leading trading companies in Russia based on IFRS statements for three years: Magnit, X5 Retail Group, Dixy, OK, M.Video. We reviewed the most important financial indicators to determine the financial condition of the borrower. However, the creditworthiness of the company is also greatly influenced by factors that provoke the emergence of risks in the business processes of the borrower. First of all, it is necessary to take into account the quality of management. This is a very difficult indicator for quantitative analysis, because. it is problematic to objectively assess the level of company management.
We will try to move from qualitative to quantitative assessment and set the maximum assessment of this indicator under the following conditions:
- there is a clear strategy for the development of the company for the coming years;
- composition of top management has not changed (general director and Chief Accountant hold positions for more than two years), because the presence of a strong management team is evidenced, among other things, by its constancy;
- professional competencies meet high requirements (availability of specialized higher education for CEO and chief accountant, work experience - more than five years).
Next important factor, which will be included in the scoring model, is the life of the company. In addition, it is necessary to introduce a stop factor: if the business has been in business for less than one year, this model will not be applicable due to the lack of reporting and the ability to understand the company's business.
Another necessary indicator is a positive credit history. This is one of the most important non-financial indicators, characterizing, in fact, the quality of servicing a future loan. It would be unreasonable to count on timely repayment of credit funds from an enterprise that has delays to other creditors. Let's present the considered non-financial indicators and the distribution of points for them in Table. 3.
Table 3. Non-financial indicators of the scoring model
| Group | Indicator indicators | Share from maximum number points for the range | |
| Business processes | Management quality | 1 | |
| 0,5 | |||
| 0 | |||
| > 5 years | 1 | ||
| 3-5 years | 0,75 | ||
| 1-3 years | 0,25 | ||
| < 1 года | Stop factor | ||
| 1 | |||
| 0,5 | |||
| 0 | |||
| The presence of a systematic delay in loans and borrowings for the last financial year; significant delay in accounts payable (> 25%) | Stop factor |
We have compiled a system of evaluation indicators, which, in our opinion, should comprehensively and comprehensively assess the quality of the borrower and his ability to fulfill his obligations. The next part of the work, when creating any scoring model, is the most time-consuming one - determining the weight of various estimated indicators. The predictive value of our model depends on how objectively we evaluate the importance of certain factors. This article will analyze the weights based on several methods to eliminate possible errors.
The weighting coefficients will first be determined using analytical procedures and then compared with the results of the regression analysis.
ANALYTICAL ESTIMATION OF THE WEIGHTING COEFFICIENTS OF THE MODEL
As an assessment tool, we will take the methodology described in detail in the TL book. Saaty "Mathematical models of conflict situations" [b]. This method allows you to get away from the variety of factors and compare only two of them for significance at a particular point in time, ultimately determining the significance of the influence of each of the factors on any general indicator. The technique is based on the compilation of matrices of paired comparisons, which are built for factors that affect any common indicator. Such matrices can be built, for example, for the solvency indicator in the context of factors represented by the coefficients of financial leverage, debt burden and interest coverage. The task is to build such matrices for all groups of factors that affect any general indicators. As a result, two matrices for the table will be created. 2 - for groups of indicators "Solvency" and "Business activity", one matrix for table. 3 - for indicators of business processes, as well as two matrices for aggregated levels - one matrix for a group of financial indicators, consisting of groups of indicators "Liquidity", "Solvency" and "Business activity", and one for two aggregated blocks - financial and non-financial indicators in general.
There are five pairwise comparison matrices in total, each of which will give its own coefficient for the indicator included in it. Thus, to obtain a weighting factor for a measure at the bottom of the hierarchy, for example, for the interest coverage ratio, it is necessary to multiply the weighting factor of the financial indicators by the weighting factor of the solvency indicators within the financial indicators and by the coefficient of the interest coverage indicator within the financial indicators.
In the headings of the matrices themselves for groups of indicators, the names of factors are placed in vertical and horizontal columns. Then the matrices are filled with values representing the transformation of the subjective preferences of one factor to another into an empirical form according to the methodology presented in Table. 4 (using data from Fig. 2).
Table 4. Method of T. Saaty. Classification of preferences (based on Fig. 2)

Mostly odd numbers are used, however, if it is difficult to choose, you can use even ones as an average level between two odd ones. An example of such a matrix for four factors is shown in Fig. 2. Accordingly, when we compare the same factor, the element takes the value 1, so such matrices are identity. It is easy to see that they are also inversely symmetric, which allows us to fill in such a matrix only for values lying either above or below the main diagonal.
Given that the matrices of pairwise comparisons are inversely symmetrical, one should only compare in one direction and enter the corresponding values into the matrix above the main diagonal, while the values under the main diagonal will be reversed.
After receiving five such matrices, the weight coefficients are calculated: the weight of each value in the matrices relative to the total sum in the column will be measured, and then the arithmetic average of these values will be taken from these values in each row. The arithmetic mean values will be the weight coefficients. An example of a matrix for a group of solvency indicators is shown in fig. 3.

Having made the described calculations, we obtain the specific weight of each indicator. For the convenience of further calculations, we define the maximum possible score as the product of the specific weight of the indicator by 50 1, followed by rounding to an integer (Table 5.6).
1 This operation is made solely for convenience, the number 50 allows the minimum coefficient to go to an integer value (in this case, the value 2). Since all coefficients are multiplied by the same number, we do not distort the results of the analytical approach. - Approx. ed.
DETERMINING THE SIGNIFICANCE OF INDICATORS USING REGRESSION ANALYSIS
To conduct a statistical study, we used data on 41 big company from the retail sector. These companies issued corporate bonds, and 16 bonds defaulted. For each company, eight selected indicators of the scoring model were calculated based on annual accounts in the year of issue corporate bonds. The sample is presented in Appendix 1. It contains an explanatory indicator y - the probability of default, which takes the value 1 if the company has not fulfilled its obligations. The selected three indicators on the right were set as dummy variables (they can only take values of 0 or 1) due to their qualitative nature. They take on the values 1 if over the past three years the company has net profit > O (Nl > 0), a stable and high-quality management team (manager) and a positive credit history (histor). Financial indicators (the first five indicators) were calculated on the basis of annual financial statements under IFRS standards in the year of issue of defaulted bonds.
As a model for the study, we choose the construction of a linear multivariate regression:
p = w 0 + w 1 x 1 + w 2 x 2 + ... + w n x n ,
where p is the dependent variable describing the probability of default;
w - weight coefficients; x - indicators.
So, let's enter the initial data in Excel and use the Data analysis - Regression function. When analyzing the initial data for eight indicators of the scoring model without adjustments, we obtain the result presented in Appendix 2. Adjusted R^2 is 0.55 - a low but acceptable value, indicating the practical significance of the constructed regression. It is possible to put forward an assumption about the reason for the low significance of the presence of outliers in the data, for example, the absence of values for some companies in terms of EBIT / Interest due to the lack of debt load (simplified, for the purposes of the study, the value of the coefficient equal to 0 was taken in this case) or the negative value of Debt / EBITDA in view of the negative cash flow. In this case, the influence of a negative indicator is incorrectly perceived, because, according to the logic of the study, the higher Debt / EBITDA, the higher the probability of default; a negative indicator, in turn, is not an indicator of a low debt burden. Also, the predictive ability is affected by companies with pronounced extreme values of individual indicators. So, the Banana-Mama company has equity capital of 10,000 rubles, which leads to a distortion of the corresponding indicators - the financial leverage is 181,957 (with industry average values in the range of 0.7-1.5).
Table 5. Financial indicators taking into account weight
| Index | Weight in the scorecard | Maximum score | Coefficient range | |
| >1 | 5 | |||
| Current liquidity ratio | 0,1072 | 5 | > 1 | 5 |
| 0,75-0,1 | 4 | |||
| 0,5-0,75 | 1 | |||
| 0-0,5 | 0 | |||
| Current liquidity ratio | 0,1581 | 8 | < 1 | 8 |
| 1-1,5 | 6 | |||
| 1,5-2 | 4 | |||
| 2-2,5 | 2 | |||
| > 2,5 | 0 | |||
| Debt Load Ratio, Net Debt / EBITDA | 0,1581 | 8 | < 1.5 | 8 |
| 1,5-2 | 4 | |||
| > 2 | 0 | |||
| 0,0790 | 4 | > 1,5 | 4 | |
| 1,3-1,5 | 3 | |||
| 1-1,3 | 2 | |||
| < 1 | 0 | |||
| Return on sales, ROS | 0,1256 | 6 | > 0,025 | 6 |
| 0,02-0,025 | 5 | |||
| 0,015-0,02 | 3 | |||
| < 0,015 | 0 | |||
| 0,0418 | 2 | Not | 2 | |
| For one reporting period | 1 | |||
| For two reporting periods or more | 0 | |||
| Total | 0,6698 | 33 | - | 68 |
Let us exclude the following six companies from the study: Gorod supermarket, Intertrade, M.Video (2013), Svyaznoy, Banana-Mama, and Proviant. We also note the impossibility of simultaneous use of ROS indicators and the absence of losses (Nl > 0) due to their high correlation. The fact is that if the company has losses, the profitability of sales automatically takes a negative value.
Table 6. Non-financial indicators by weight
| Index | Weight in the scorecard | Maximum score | Ratio Range / Estimation Methodology | Number of points for the weight range |
| Management quality | 0,099 | 5 | Fulfillment of all described conditions | 5 |
| Failure to meet one of the conditions | 2,5 | |||
| Failure to meet more than one condition | 0 | |||
| The life of the company | 0,0528 | 3 | > 5 years | 3 |
| 3-5 years | 2 | |||
| 1-3 years | 1 | |||
| < 1 года | Stop factor | |||
| Positive credit history | 0,1782 | 9 | Absence of delinquencies on loans and borrowings, overdue accounts payable | 9 |
| Availability of information on debt restructuring; insignificant delays in accounts payable (up to 10%) | 4,5 | |||
| A single case of delay on loans and credits with subsequent repayment; significant delays in accounts payable (10-25% of the total debt) | 0 | |||
| The presence of a systematic delay in loans and borrowings for the last financial year; Significant amount of overdue accounts payable (>25%) | Stop factor | |||
| Total | 17 |
Based on these considerations, we remove the indicator Nl > 0 from our model. For a new seven-factor regression on an updated sample of 35 companies, we get the following result (Appendix 3). We see that six of the seven studied indicators are significant. The signs at the coefficients correctly reflect the assumptions made above: the higher the profitability of sales and the quality of management, the lower the probability of default (y = 1), and vice versa: the higher the debt load, the higher the probability of default. At first glance, the sign is incorrect only for the current liquidity ratio. However, high liquidity values are just as bad as small ones - they indicate low business efficiency and lost profits. Companies with large liquidity ratios are prone to shortfalls in profits, low profitability and business profitability, which makes them less attractive in the eyes of potential investors, and therefore more vulnerable to changes. financial terms. The most significant are the coefficients D (or Debt - the volume of interest-bearing debt) / EBITDA, positive credit history and financial leverage; the interest coverage ratio is insignificant.
Above, when modeling the coefficients using the T. Saaty method, we also assumed that the most significant indicators would be the coefficients for the debt load and financial leverage. Comparative analysis the final significance of the coefficients is given in table. 7.
Table 7. Comparative analysis of the significance of the coefficients
| Indicator based on expert assessments according to the method of T. Saaty | Coefficient | Indicator based on regression analysis | p-value |
| Positive credit history | 0,1782 | Debt Load Ratio, Net Debt / EBITDA | 0,014 |
| Financial leverage ratio | 0,1581 | Positive credit history | 0,020 |
| Debt Load Ratio, Net Debt /EBITDA | 0,1581 | Financial leverage ratio | 0,022 |
| Return on sales, ROS | 0,1256 | Management quality | 0,037 |
| Current liquidity ratio | 0,1072 | Return on sales, ROS | 0,039 |
| Management quality | 0,099 | Current liquidity ratio | 0,047 |
| Interest coverage ratio, EBIT / Interest | 0,0790 | Interest coverage ratio, EBIT / Interest | Insignificant |
| Company's loss for the last three reporting periods | 0,0418 | Company's loss for the last three reporting periods | Was studied as a non-financial indicator, insignificant |
These results indicate the consistency of the method of T. Saaty and statistical data. The three most significant indicators according to the analytical approach confirm their high significance in a practical study, only the distribution of the order of the indicators themselves has changed. Also, the two least significant indicators for the first part of the work - the quality of management and EBIT / Interest - turned out to be insignificant in the statistical study.
Thus, the regression analysis confirms the principles of classification of the significance of weight coefficients in the analytical part of the work and allows us to speak about the statistical significance of the constructed scoring model.
DETERMINING THE RESULTS OF THE DEVELOPED SCORING MODEL
The total maximum score of the scoring model is 50. For each indicator, in the process of determining the ranges of values, we identified the next level after the maximum score, which is also acceptable, albeit with a relatively high level of risk, based on market values of the indicators. For some indicators, the level following the maximum was 75% of the total number of points, for others - 50%. All subsequent levels will be considered levels with high credit risk and the corresponding borrowers will be classified as bad. The most preferred group includes borrowers who meet the maximum requirements for the most significant (in terms of weight coefficients) indicators: credit history, financial leverage and debt load, as well as return on sales in the amount of 31 points and fulfillment of at least the following maximum level of requirements for other indicators - 12.5 in total. Total 43.5 points for the lower level of high creditworthiness.
To determine the boundary interval characterizing a high degree of creditworthiness, we calculate the number of points for financial and non-financial indicators in the next after the maximum range of values from Table. 5 and b. The indicators are divided according to the accepted values of the coefficients into other ranges. We will get the following classification (Table 8).
Table 8. Classification of results
Table 9. Predictive ability of the scoring model, %
Based on Table. 8, we will evaluate the predictive ability of our model by substituting company data into its conditions. Appendix 4 shows the calculated scores for the surveyed companies. Depending on the value of the indicator, its score was entered in the table according to the developed model, and then all the scores were summed up into an integral indicator (“Sum” column). Based on the total scores, companies were divided into three classes, then the data was compared with the actual presence or absence of a default by the company. In the column "True or not", 1 means the correct result of the scoring model, 0 - an error. Thus, we got the following result (Table 9).
We received an average (relative to those described in various sources) result for predictive ability of scoring models. However, it is worth noting low interest errors of the second kind, which increases the predictive value of our model. This result can be considered positive and confirms the effectiveness of the study.
CONCLUSION
In this paper, a scoring model was proposed to assess the creditworthiness of large retail trade enterprises. The model is based on a set of performance indicators that make it possible to comprehensively assess the financial and non-financial condition of the borrower.
Based on the results of the assessment, the borrower is assigned one of three creditworthiness classes, which characterizes the degree of credit risk and the feasibility of lending.
We modeled a system of performance indicators that allow us to most accurately assess the condition of a borrower from the retail sector. After analyzing the leaders of the retail market and calculating the indicators used for them, we determined the boundaries of acceptable values for them and ranked them in different groups with different percentages of the maximum possible score.
The most time-consuming task was to determine the weighting coefficients for the studied indicators. It was concluded that an integrated approach is needed due to the lack of any one ideal method. The integrated approach was implemented as follows: in the first part of the work, the weight coefficients were determined using analytical procedures, and in the second part, using a statistical study.
The developed model showed high results in predictive ability, while it does not require large resource costs for analysis. The commissioning of the developed scoring system will increase the efficiency of credit decision-making in the field of large retail enterprises and optimize the credit process.
Literature
1. Ayvazyan S.A., Mkhitaryan B.C. Applied statistics and foundations of econometrics. - M.: GU HSE, 1998.
2. Gavrilova A.H. Organization finances. - M.: Knorus, 2007.
3. Korobova G.G., Petrov M.A. Solvency of a bank borrower and its assessment in a competitive environment // Banking services. -2005. -No. 7/8. -C. 22-24.
4. Kulikov N.I., Chainikova L.I. Assessment of the creditworthiness of the enterprise-borrower. - Tambov: University of TSTU, 2007.
5. Regulation of the Central Bank of the Russian Federation No. 254-P "On the procedure for the formation by credit institutions of reserves for possible losses on loans, on loan and equivalent debt" dated March 26, 2004 - http://base.garant.ru/584458/.
6. Saati T.L. Mathematical Models of Conflict Situations / Ed. I.A. Ushakov. - M.: Soviet radio, 1977.
7. Sheremet A.D., Saifulin R.C., Negashev H.B. Methods of financial analysis. - M.: Infra-M, 2001.
8. Abdou H.A., Pointon J. (2011). "Credit scoring, statistical techniques and evaluation criteria: a review of the literature". Intelligent Systems in Accounting, Finance & Management, Vol. 18, no. 2-3, pp. 59-88.
9. Bailey M. (2004). Consumer Credit Quality: Underwriting, Scoring, Fraud Prevention and Collections. White Box Publishing, Kingswood, Bristol.
10. Crook J., Edelman D., Thomas L. (2007). "Recent developments in consumer credit risk assessment". European Journal of Operational Research, Vol. 183, no. 3, pp. 1447-1465.
11. Gately E. (1996). Neural Networks for Financial Forecasting: Top Techniques for Designing and Applying the Latest Trading Systems. New York: John Wiley & Sons, Inc.
12. Guillen M., Artis M. (1992). Count Data Models for a Credit Scoring System: the European Conference Series in Quantitative Economics and Econometrics on Econometrics of Duration, Count and Transition Models. Paris.
13. Heffernan S. (2004). modern banking. John Wiley & Sons, Inc., Chichester, West Sussex.
14. Liang Q. (2003). "Corporate financial distress in China: an empirical analysis using credit scoring models". Hitotsubashi Journal of Commerce and Management, Vol. 38, no. 1, pp. 13-28.
ATTACHMENT 1.
Study sample
| № | Company | y / Default flag | Current liquidity ratio | EBIT / Interest/ EBIT to interest ratio | NI > 0/ Presence of net profit | |||||
| 1 | Pharmacy 36.6 | 0 | 0,82 | 1,32 | 2,41 | 1,83 | 0,0496 | 1 | 1 | 1 |
| 2 | L "Etoile | 0 | 5,04 | 2,75 | 10,98 | 1,64 | 0,007 | 1 | 1 | 1 |
| 3 | Bark | 0 | 0,795 | 0,77 | 3,13 | 1,89 | 0 | 0 | 1 | 1 |
| 4 | Ribbon | 0 | 0,75 | 9,7 | 2,91 | 3,1 | 0,049 | 1 | 1 | 1 |
| 5 | OK | 0 | 0,67 | 0,78 | 1,59 | 7,01 | 0,0357 | 1 | 1 | 1 |
| 6 | Autoworld | 0 | 1,2 | 0,65 | 3,09 | 1,35 | 0,04 | 1 | 1 | 1 |
| 7 | Х5 Retail Group | 0 | 0,55 | 0,53 | 3,32 | 2,82 | 0,027 | 1 | 1 | 1 |
| 8 | City | 0 | 0,99 | 18,97 | 10,25 | 1,29 | 0,01 | 1 | 1 | 0 |
| 9 | Child's world | 0 | 0,93 | 0,83 | 2,14 | 3,99 | 0,032 | 1 | 1 | 1 |
| 10 | Dixie | 0 | 0,77 | 1,19 | 6,1 | 1,78 | 0,01 | 1 | 1 | 1 |
| 11 | InterTrade | 0 | 1,24 | 20,65 | 4,92 | 2,1 | 0,015 | 1 | 1 | 0 |
| 12 | Carousel | 0 | 0,73 | 0,68 | 3,175 | 1,71 | 0,059 | 1 | 1 | 1 |
| 13 | penny | 0 | 0,68 | 2,93 | 7,03 | 1,82 | 0 | 0 | 1 | 1 |
| 14 | Kosmos Group | 0 | 1,64 | 1,11 | 2,88 | 2,65 | 0,043 | 1 | 1 | 1 |
| 15 | Magnet | 0 | and | 0,54 | 1,11 | 10,2 | 0,061 | 1 | 1 | 1 |
| 16 | Magnolia | 0 | 0,27 | 2,35 | 3,55 | 1,02 | 0,064 | 1 | 1 | 1 |
| 17 | M.Video (2007) | 0 | 1,31 | 0,73 | 1,9 | 2,58 | 0,013 | 1 | 1 | 1 |
| 18 | M.Video (2013) | 0 | 0,95 | 0 | 0 | 0 | 0,039 | 1 | 1 | 1 |
| 19 | JSC "NTS" | 0 | 1,18 | 3,09 | 5,44 | 1,05 | 0,21 | 1 | 0 | 1 |
| 20 | Shoes of Russia | 0 | 0,87 | 2,34 | 1,87 | 5,65 | 0,1 | 1 | 1 | 1 |
| 21 | Crossroads (2005) | 0 | 0,54 | 1,09 | 3,16 | 3,92 | 0,026 | 1 | 1 | 1 |
| 22 | Pivdom | 0 | 1,99 | 3 | 8 | 1,1 | 0,0006 | 1 | 0 | 1 |
| 23 | A family | 0 | 10 | 0,28 | 1,66 | 6 | 0,58 | 1 | 1 | 1 |
| 24 | Svyaznoy | 0 | 1,07 | 0 | 0 | 0 | 0,001 | 1 | 1 | 1 |
| 25 | Elekam | 0 | 1,44 | 1,82 | 4,25 | 1,3 | 0,01 | 1 | 1 | 1 |
| 26 | Macro | 1 | 1 | 15 | 11 | 1,52 | 0,01 | 1 | 0 | 1 |
| 27 | Prestige Express | 1 | 8 | 0,98 | 12,43 | 1,02 | 0,002 | 1 | 0 | 1 |
| 28 | Arbat Prestige | 1 | 0,49 | 1,81 | 7,6 | 1,45 | 0,017 | 1 | 1 | 0 |
| 29 | Orchid | 1 | 3 | 1,164 | 13 | 0 | 0,01 | 1 | 0 | 1 |
| 30 | Banana Mom | 1 | 0,94 | 181957 | -35 | -0,6 | -0,033 | 0 | 1 | 0 |
| 31 | white frigate | 1 | 7 | 932 | 8,76 | 0,88 | -0,4 | 0 | 1 | 1 |
| 32 | Martha | 1 | 3,96 | 20 | 11 | 1/17 | 0,003 | 1 | 1 | 1 |
| 33 | Matrix | 1 | 2,38 | 21 | 6,82 | 1 | 0,001 | 1 | 0 | 0 |
| 34 | Mercury (self-praise) |
1 | 1,12 | 9,98 | 7,32 | 1,27 | 0,003 | 1 | 1 | 1 |
| 35 | Minnesco | 1 | 0,79 | 4,39 | 12 | 0,12 | -0,047 | 0 | 1 | 1 |
| 36 | Mosmart | 1 | 12 | 5 | 8 | 1,5 | 0 | 0 | 0 | 0 |
| 37 | Polissya | 1 | 7,93 | 15 | 14 | 1,03 | 0,003 | 1 | 0 | 1 |
| 38 | Provision | 1 | 0,12 | 35557 | 0 | 0 | -0,819 | 0 | 0 | 1 |
| 39 | seventh continent | 1 | 1,93 | 0,41 | 1,52 | 1,35 | 0,07 | 1 | 0 | 1 |
| 40 | Technosila | 1 | 14 | 18 | 10,36 | 1 | 0,002 | 1 | 1 | 1 |
| 41 | TOAP | 1 | 7 | 22 | 10,83 | 1,04 | 0,009 | 0 | 0 | 1 |
Note: if the company had a default, then the coefficient takes the value 1, and 0 if there was no default.
APPENDIX 2
Regression on eight factors for 41 companies
| Regression and Residual | DF / Number of degrees of freedom | SS / Sum of squares | MS=SS/DF | F-statistic | Significance F / Significance |
| Regression / Regression | 8 | 6,250849408 | 0,781356176 | 7,133131961 | 2.17209Е-05 |
| Residual | 32 | 3,505248153 | 0,109539005 | - | - |
| Total / Total | 40 | 9,756097561 | - | - | - |
| Parameters Used | tStat/ t-statistic | P-vaiue / Significance | ||
| Intercept / Constant | 0,354797355 | 0,281481615 | 1,260463691 | 0,216616062 |
| Current liquidity ratio | 0,034652978 | 0,01876389 | 1,846790732 | 0,074043212 |
| Leverage / Financial leverage | 1.31819Е-05 | 4.77939E-06 | 2,758072506 | 0,009529947 |
| D / EBITDA / Interest-bearing debt to EBITDA ratio | 0,044980795 | 0,018152923 | 2,477881708 | 0,018682248 |
| -0,012377044 | 0,030936193 | -0,40008296 | 0,691753745 | |
| ROS / Return on sales | -0,530759612 | 0,375019201 | -1,415286499 | 0,166643428 |
| NI > 0 / Presence of net profit | -0,02891433 | 0,164713359 | -0,175543319 | 0,861758855 |
| Manager / Quality Management | -0.266367tl2 | 0,134861932 | -1,975109717 | 0,056935374 |
| Histor/ Quality of credit history | -0,109402928 | 0,159841844 | -0,684444857 | 0,498621797 |
APPENDIX 3
Regression on seven factors for 35 companies
| Regression and Residual | DFI Number of degrees of freedom | SS / Sum of squares | MS=SS/DF | F-statistic | Significance F / Significance F |
| Regression / Regression | 7 | 5,898901667 | 0,842700238 | 9,097165886 | 9.56Е-06 |
| Residual | 27 | 2,501098333 | 0,092633272 | - | - |
| Total / Total | 34 | 8,4 | - | - | - |
| Parameters Used | Coefficients / Coefficients | Standard Error / Standard Error | t Stat/ t-statistic | P-value / Significance |
| Intercept / Constant | 0,473712463 | 0,25308461 | 1,871755309 | 0,072111654 |
| Current liquidity ratio | 0,018420061 | 0,017803477 | 1,034632774 | 0,047018946 |
| Leverage / Financial leverage | 0,017110959 | 0,009674238 | 1,768713818 | 0,022823937 |
| D / EBITDA / Interest-bearing debt to EBITDA ratio | 0,046019604 | 0,021802198 | 2,110778177 | 0,014194286 |
| EBIT / Interest / EBIT to interest ratio | -0,004583381 | 0,032996403 | -0,13890548 | 0,89055573 |
| ROS / Return on sales | -0,582081686 | 0,483677061 | -1,203451088 | 0,039247801 |
| Manager / Quality Management | -0,174077167 | 0,138900851 | -1,253247659 | 0,03786026 |
| Histor / Quality of credit history | -0,378981463 | 0,194742843 | -1,946061058 | 0,020243892 |
APPENDIX 4
Evaluation of companies from the sample using the scoring model
| Company | At | Current liquidity ratio | Leverage / Financial leverage | D / EBITDA / Interest-bearing debt to EBITDA ratio | EBIT / Interest / EBIT to interest ratio | ROS / Return on sales | Manager / Quality Management | Histor / Positive credit history | The life of the company | Sum | Class | True or not* |
| Pharmacy 36.6 | 0 | 4 | 6 | 4 | 4 | 6 | 5 | 9 | 3 | 41 | 2 | 1 |
| L "Etoile | 0 | 5 | 0 | 0 | 4 | 0 | 5 | 9 | 3 | 26 | 3 | 0 |
| Bark | 0 | 4 | 8 | 0 | 4 | 0 | 5 | 9 | 3 | 33 | 2 | 1 |
| Ribbon | 0 | 1 | 0 | 0 | 4 | 6 | 5 | 9 | 3 | 28 | 3 | 0 |
| OK | 0 | 1 | 8 | 4 | 4 | 6 | 5 | 9 | 3 | 40 | 2 | 1 |
| Autoworld | 0 | 5 | 8 | 0 | 3 | 6 | 5 | 9 | 3 | 39 | 2 | 1 |
| Х5 Retail Group | 0 | 1 | 8 | 0 | 4 | 5 | 5 | 9 | 3 | 35 | 2 | 1 |
| Child's world | 0 | 4 | 8 | 4 | 4 | 6 | 5 | 9 | 3 | 43 | 2 | 1 |
| Dixie | 0 | 4 | 6 | 0 | 4 | 0 | 5 | 9 | 3 | 31 | 2 | 1 |
| Carousel | 0 | 1 | 8 | 0 | 4 | 6 | 5 | 9 | 3 | 36 | 2 | 1 |
| penny | 0 | 1 | 0 | 0 | 4 | 0 | 5 | 9 | 3 | 22 | 3 | 0 |
| Kosmos Group | 0 | 5 | 6 | 0 | 4 | 6 | 5 | 9 | 3 | 38 | 2 | 1 |
| Magnet | 0 | 5 | 8 | 8 | 4 | 6 | 5 | 9 | 3 | 48 | 1 | 1 |
| Magnolia | 0 | 0 | 2 | 0 | 2 | 6 | 5 | 9 | 3 | 27 | 3 | 0 |
| M.Video (2007) | 0 | 5 | 8 | 4 | 4 | 0 | 5 | 9 | 3 | 38 | 2 | 1 |
| JSC "NTS" | 0 | 5 | 0 | 0 | 2 | 6 | 0 | 9 | 3 | 25 | 3 | 0 |
| Shoes of Russia | 0 | 4 | 2 | 4 | 4 | 6 | 5 | 9 | 3 | 37 | 2 | 1 |
| Crossroads (2005) | 0 | 1 | 6 | 0 | 4 | 5 | 5 | 9 | 3 | 33 | 2 | 1 |
| Pivdom | 0 | 5 | 0 | 0 | 2 | 0 | 0 | 9 | 3 | 19 | 3 | 0 |
| A family | 0 | 5 | 8 | 4 | 4 | 6 | 5 | 9 | 3 | 44 | 1 | 1 |
| Elekam | 0 | 5 | 4 | 0 | 2 | 0 | 5 | 9 | 3 | 28 | 3 | 0 |
| Macro | 1 | 4 | 0 | 0 | 4 | 0 | 0 | 9 | 3 | 20 | 3 | 1 |
| Prestige Express | 1 | 5 | 8 | 0 | 2 | 0 | 0 | 9 | 3 | 27 | 3 | 1 |
| Arbat Prestige | 1 | 0 | 4 | 0 | 3 | 0 | 5 | 0 | 3 | 15 | 3 | 1 |
| Orchid | 1 | 5 | 6 | 0 | 0 | 0 | 0 | 9 | 3 | 23 | 3 | 1 |
| white frigate | 1 | 5 | 0 | 0 | 0 | 0 | 5 | 9 | 3 | 22 | 3 | 1 |
| Martha | 1 | 5 | 0 | 0 | 2 | 0 | 5 | 9 | 3 | 24 | 3 | 1 |
| Matrix | 1 | 5 | 0 | 0 | 0 | 0 | 0 | 0 | 3 | 8 | 3 | 1 |
| Mercury (self-praise) | 1 | 5 | 0 | 0 | 2 | 0 | 5 | 9 | 3 | 24 | 3 | 1 |
| Minnesco | 1 | 4 | 0 | 0 | 0 | 0 | 5 | 9 | 3 | 21 | 3 | 1 |
| Mosmart | 1 | 5 | 0 | 0 | 3 | 0 | 0 | 0 | 3 | 11 | 3 | 1 |
| Polissya | 1 | 5 | 0 | 0 | 2 | 0 | 0 | 9 | 3 | 19 | 3 | 1 |
| seventh continent | 1 | 5 | 8 | 4 | 3 | 6 | 0 | 9 | 3 | 38 | 2 | 0 |
| Technosila | 1 | 5 | 0 | 0 | 0 | 0 | 5 | 9 | 3 | 22 | 3 | 1 |
| TOAP | 1 | 5 | 0 | 0 | 2 | 0 | 0 | 9 | 3 | 19 | 3 | 1 |
* The column shows whether we received the correct decision on lending to the company according to the scoring model.
Send your good work in the knowledge base is simple. Use the form below
Students, graduate students, young scientists who use the knowledge base in their studies and work will be very grateful to you.
In many cases, domestic banks in practice apply creditworthiness analysis models based on a system of financial indicators, which make it possible to assess the financial position of the borrower. But these models, as well as classification models, have their drawbacks, such as the development of normative values for comparison, since there is a spread of values due to the industry specifics of borrowing enterprises. As for the optimal normative values of financial indicators given in the relevant literature, they are calculated without taking into account industry specifics. Due to the lack of a unified regulatory framework for industries, an objective analysis of the financial position of the borrower is impossible, since there are no comparative industry average, minimum acceptable and best indicators for this industry.
1.5 Scoring model as a tool for assessing creditworthiness
Banks attract qualified specialists to assess creditworthiness. For example, not so long ago, a financial analysis department of the Financial Analysis and Methodology of Credit Projects Department was established at Bank International OJSC, the purpose of which is to conduct a comprehensive and objective analysis of the activities of the borrower (mortgagor, guarantor) in order to determine the level of credit risk for loans granted. But the involvement of such specialists indicates some negative aspects:
The opinion of specialists is subjective - the accuracy of the assessment depends on the professionalism of employees, their knowledge and experience;
Employees are physically unable to quickly process large amounts of information - hence the limitation of the number of applications under consideration;
Thirdly, attracting qualified specialists requires significant expenses - such employees usually have high wages.
In connection with the points outlined above, it becomes clear that banks are highly interested in such loan classification systems that would minimize the participation of experts in decision-making and would reduce the importance of the human factor. There are two main methods for assessing credit risk: the subjective opinion of qualified specialists and automated credit scoring systems.
Credit scoring is a kind of rating, a technique proposed in the early 40s of the twentieth century by the American scientist D. Duran to select borrowers according to consumer credit. The difference between credit scoring and rating is that in the rating formula, instead of the value of the indicator, its private score is used. For each indicator, several intervals of values are determined, each interval is assigned a certain number of points or a class is determined. If the rating received by the borrower is lower than the value previously set by the bank employees, then such a borrower will be denied a loan, and if it complies with the standards, then loan application will be satisfied. In this context, it should be noted that initially the credit scoring model was focused on individual borrowers. Only later, when the model was worked out and proved its effectiveness on consumer lending, the model began to be used to assess the creditworthiness of legal entities.
As for the use of the credit scoring model by domestic banks, in this context, scoring of loans of enterprises - legal entities is a method for assessing the quality of a borrower based on various characteristics of the financial position of an enterprise. As a result of the analysis of variables, an integrated indicator in points is obtained, which assesses the degree of creditworthiness of the borrower on a rank scale. Depending on the score, a decision is made on issuing a loan, on loan limits. In the case of Bank International OJSC, the scoring model makes it possible to draw a conclusion about the quality of the financial position of the borrower and the amount of the provision for possible losses on loans. This scoring model combines the assessment of credit risk, business risk and credit history risk. More about these types of risk is described below.
The main purpose of using the scoring model is to increase awareness of the real financial and economic situation of potential borrowers. The model not only allows assessing the real financial condition, but also the credit potential of enterprises that meet the requirements for lending to borrowers. An important difference between the credit scoring model and the expert's subjective assessment is that the scoring assessments are based on a mathematical and statistical analysis of the credit history of the bank's "past" borrowers and imply a more objective risk assessment system.
Thus, the problems that the credit scoring model can solve are as follows:
subjectivism - often decisions made by loan officers are based only on intuition and personal experience;
inflexibility and instability - the quality of the assessment is a random variable that cannot be improved or worsened, and depends on the emotional state and preferences of the expert;
lack of a system of training, transfer of knowledge and advanced training - before becoming a highly qualified specialist, it is necessary to accumulate a certain level of knowledge based on acquiring sufficient experience in this field;
limiting the number of applications considered, which is due to limited human physical resources, as a result of this - lost profits from a small number of applications considered.
These shortcomings can be solved using a scoring model, since its advantages are simplicity (since it is enough to calculate financial ratios and, taking into account the coefficients of their significance, determine the class of the borrower), the ability to calculate optimal values for private indicators, the ability to rank organizations by results , an integrated approach to assessing creditworthiness (since indicators are used that reflect various aspects of the organization's activities). However, when using a scoring model, a number of problems should be taken into account:
the need for careful selection of financial indicators (it is required to use indicators that describe different aspects of the borrower's work);
the importance of substantiating the threshold values of indicators (in Russia it is quite difficult to implement such an approach, since there is not enough information about the actual state and levels of these indicators in the Russian economy, as well as a small degree of participation of banks in the formation of such a database);
the need to justify the significance coefficients for each system of indicators in accordance with the industry of activity of a particular enterprise - the borrower;
determining the magnitude of deviations in the border areas relating borrowers to different classes;
the rating assessment takes into account the levels of indicators only relative to the optimal values corresponding to certain established standards, but does not take into account the degree of their implementation or non-fulfillment;
the system of calculated coefficients does not take into account many factors - the reputation of the borrower, prospects and features of the market situation, evaluation of manufactured and sold products, investment prospects.
The scoring model is one example of the successful application of statistical and mathematical methods. However, in Russia the scoring model has not been widely used. According to G. Andreeva, the wide spread of scoring is hindered not so much by objective as by subjective reasons, of which the main reason is the distrustful attitude of bank managers to mathematical and statistical methods. If we talk about domestic banks, then the use of scoring models in banks is combined with an expert assessment. In banks, for each large enterprise - the borrower, a responsible loan officer is appointed who oversees the financial analysis of this borrower. Due to the low development of scoring models, it will be interesting to consider this topic using the example of a particular bank.
Chapter 2
2.1 Brief description of the activities of OJSC "Bank International"
The bank was registered by the Central Bank Russian Federation in November 1989 as "St. Petersburg Timber Bank". In 1999, the Bank was renamed into International Bank. The main direction of the Bank's credit policy in 1999 was the formation of a powerful universal client base. By offering the leading corporations of St. Petersburg and the North-West region a unique complex financial service The Bank was able to attract over 500 largest enterprises in industry, trade, transport, construction and other industries for servicing during the year.
A feature of the Bank's work was the assignment of a personal manager to each client company, who promptly resolves all emerging issues of the enterprise related to banking services. In this context, I would like to note that the Bank did not rely on automated credit risk management systems, but on the expert assessment of bank employees, which, within the framework of the diploma topic under consideration, is rather a counterargument to the use of the scoring model. That is, the model itself does not adequately reflect the credit risk of the counterparty if each stage of obtaining points for a particular risk item is not controlled. loan officer within the framework of drawing up an expert judgment on the level of risk.
Further, in 2000, JSC "Bank International" enters the Moscow market, where the first regional division of the Bank was opened. 65 legal entities became clients of the branch, among which are large enterprises and organizations such as State Transport Company Rossiya, a representative office of JSC Samara Airlines, JSC Mostotrest, representative offices of St. companies "Express Line", LLC "Schetmash", CJSC "TD" Dargez ", a group of companies" Steel structures" and others .
At present, the main activity of the Bank is lending to large corporate clients that occupy leading positions in the trade, leasing, construction, manufacturing and defense industries. The bank has 5 branches in the Russian Federation: in Volgograd, Moscow, Nizhny Novgorod, Novosibirsk and Ulyanovsk.
Lending in the Bank is assigned the role of the main mechanism for generating income from the placement of own and borrowed funds and, at the same time, a product that satisfies the needs of the Bank's customers in borrowed money Oh. In addition, lending is used as a tool to attract new bank customers, maintain the existing customer base, expand areas and increase the volume of the Bank's business.
AT credit policy JSC "Bank International" identified the following objectives of lending as a banking business:
Formation of a loan portfolio balanced in terms of structure and types of risks within the limits of the Bank's loan investments established by the Bank's Financial Plan.
Maintaining optimal profitability of the loan portfolio.
Ensuring an acceptable level of risk in lending operations.
Expansion of volumes and areas of the Bank's business.
Maximum satisfaction of the needs of the Bank's customers in loan products.
JSC "Bank International" positions itself as a universal financial institution, and in accordance with this offers corporate clients a wide range of credit instruments:
Short-term lending, including in the form of a credit line with an issue limit, with a debt limit and an overdraft;
Financing of leasing operations;
Lending for the purchase of bills of exchange of the Bank (bill lending);
Documentary transactions associated with credit risk for the Bank.
Financing of foreign trade operations;
Purchase of debt obligations (bills, bonds) of third parties;
Investment lending (project financing).
In accordance with credit policy The Bank's priority areas for lending to JSC "Bank International" are the following sectors of the economy:
extraction and processing, sale of hydrocarbon raw materials (oil, gas) and products of their processing;
food industry;
pharmaceutical industry;
energy industry;
military-industrial complex;
transport, including road, rail, air;
logistics;
trade, including wholesale and retail consumer goods, etc.;
financing of leasing activities in the above sectors.
Taking into account the successful activity of the Bank in the financial market for a little more than 20 years, it should be noted that the Bank's ratings are quite high. The international rating agency "Standard & Poor's" in 2012 raised the long-term credit rating of the Bank on the international scale to "B" - stable. On the national scale, the Bank's rating was also upgraded to the level of "ruBBB+".
Thus, JSC "Bank International" has been successfully operating in the financial market of Russia for quite a long time. Within the framework of the topic under consideration, the WRC should focus on the bank's risk management system. The Bank provides a sufficient level of profitability without building up "risk appetite", using an exclusive model of "individual approach to clients" . One of the tools of this model is the scoring model in combination with qualitative analysis financial position of borrowers.
2.2 Selection of borrowers - legal entities, clients of Bank International OJSC for creditworthiness analysis
When starting to analyze the financial position of borrowers - legal entities, clients of Bank International OJSC, it should be noted that this analysis is necessary for subsequent calculations using the scoring model. In addition, it would not be superfluous to pay attention to the Bank's management, which is engaged in financial analysis.
The name of this department is as follows: "Department of Financial Analysis and Methodology of Credit Projects of the Department for Analysis and Control of Credit Projects". This department is engaged in the implementation of quarterly monitoring of the financial situation of the borrower. For legal entities, the financial position of the borrower is assessed based on the analysis of changes in the financial condition of the enterprise, the identification of negative aspects in the financial and economic activities of the borrower. Based on the results of quarterly monitoring, the Department forms a professional judgment on the level of risk on loans, classifies loan debt by quality categories, indicating the percentage of the estimated reserve.
After considering the activities of the Bank's Financial Analysis Department, you can proceed to the calculations. For creditworthiness analysis within this study 33 borrowers were selected. The sample of these borrowers was formed on the basis of the following assumptions: the selected borrowers are legal entities, large corporate clients; selected borrowers vary by industry; for the selected borrowers, the information necessary for settlements is available. I would like to clarify that the choice of borrowers was due to the fact that in April 2013 the Bank conducted a quarterly monitoring of the financial position of the statements of the above borrowers. Also, the presence of borrowers in different industries in the sample allows us to study differences in the analysis of the creditworthiness of industries, which is undoubtedly an advantage for a comprehensive study. Table 2.1. the distribution of borrowers by areas of activity is presented.
Table 2.1 - Enterprises - borrowers, distribution by industry
|
Trading companies (16) |
Construction companies (9) |
|
|
ABM Trade LLC |
CJSC "I-Invest" |
|
|
AVRO LLC |
GAMMA LLC |
|
|
Agroalliance MT LLC |
OJSC "GSK" |
|
|
OOO "Alexandria" |
KVS LLC |
|
|
LLC "White Wind Digital" |
CJSC "New Era" |
|
|
Eurotransavto LLC |
Polyus LLC |
|
|
Eurotrans LLC |
LLC "PromTechService" |
|
|
OOO "Optima" |
OOO Construction Trust No. 3 |
|
|
RKB LLC |
Elis-Construction LLC |
|
|
OOO "Santi" |
Manufacturing companies (6) |
|
|
OOO SPb Nefteprodukt |
ANGSTREM Trading LLC |
|
|
STK Motto LLC |
DSK No. 5 LLC |
|
|
Tav Oil LLC |
Illung LLC |
|
|
OOO Trade from Petmola wholesale |
CJSC "PoleCom" |
|
|
CJSC Financial Company Forum |
LLC Prionezhskaya Mining Company |
|
|
UNIFROST LLC |
CJSC "RUAN" |
|
|
Leasing companies (1) |
Transport companies (1) |
|
|
CJSC Leasing Technologies |
LLC "Transport Company" "Stell" |
Significant indicators for selected borrowers are given in Appendices 1-33 to the WRC. Significant indicators include the aggregate balance sheet of the borrower, the structure of assets and the structure of liabilities. The applications are in the same order as the borrowers shown in Table 2.1.
For a more visual representation of borrowers by industry, you can look at Fig. 2.1. It can be seen from the figure that most of the sample consisted of trading companies (49% of the sample), as well as construction (27%) and manufacturing companies (18%). That is, in the sample there are 16 trading companies, 9 construction companies, 6 manufacturing companies, 1 leasing and 1 transport company.
Rice. 2.1. Distribution of borrowers in the sample by industry
2.3 Analysis of the financial position of borrowers based on the methodology of JSC "Bank International"
After the initial study of the sample, you can proceed directly to the financial analysis of borrowers. It should be noted that the financial analysis was carried out on the basis of the Bank's methodology given in the "Instructions on short-term lending to legal entities" . In this internal normative document The Bank has consistently presented an algorithm for analyzing the financial position of the borrower.
For a visual representation of the work done, an analysis of the financial situation of one of the 33 borrowers will be presented, since it makes no sense to present an analysis of all 33 borrowers due to the large amount of analysis. However, the results of calculating the financial ratios of other borrowers can be found in Appendix 34 to the WRC.
For a visual representation of the work done, an analysis of the financial position of one of the 33 borrowers is presented, since it makes no sense to present an analysis of all 33 borrowers due to the large amount of analysis. However, the results of calculating the financial ratios of other borrowers can be found in Appendix 34 to this work. Appendices 1-33 to the WRC provide data on other borrowers. The companies in Appendices 1-33 are presented in the same order as in Table 2.1. The format of the given data: significant indicators- aggregated balance sheet, structure of assets and structure of liabilities. Data for all companies are presented for 5 quarters - 4 quarters of 2012 and the last quarter of the previous year, 2011.
Thus, for a representative financial analysis, a borrower was selected Company with limited liability TaV Oil. The choice of this borrower among the other 33 borrowers is due to the fact that the structure of the financial statements of this borrower is most suitable for reflecting all the features of the analysis of the financial position of the borrower. The borrower has reports with a sufficient proportion of indicators in the structure of assets and liabilities, so that in the future, using its example, it would be possible to reveal the methodology of the scoring model.
Tav Oil LLC was registered on October 24, 2003. The company has been operating in the oil products market since 2003. The main activity of the company is the wholesale trade of petroleum products. The company works with suppliers of oil products on a prepaid basis, and with buyers - with a deferred payment depending on the type of oil products (in fact, up to 30 calendar days).
In accordance with the "Instruction on short-term lending to legal entities" based on the data financial statements an analytical table (aggregate balance sheet) was formed indicating the main absolute financial indicators as of 01.01.2012, 01.04.2012. 07/01/2012 and 10/01/2012, 01/01/2013 (for 4 quarters + reporting quarter). Table 2.2. below.
Table 2.2 - Indicators balance sheet and income statement (thousand rubles):
|
Index |
||||||
|
Balance currency |
||||||
|
Capital and reserves |
||||||
|
Undistributed profit Loss) |
||||||
|
Fixed assets |
||||||
|
VAT on purchase values |
||||||
|
Accounts receivable |
||||||
|
Short-term financial Attachments |
||||||
|
Cash |
||||||
|
Other current assets |
||||||
|
Total current assets |
||||||
|
Loans and credits long-term |
||||||
|
Total long-term liabilities |
||||||
|
Credits and loans short-term |
||||||
|
Accounts payable |
||||||
|
revenue of the future periods |
||||||
|
Total current liabilities |
||||||
|
Sales revenue (cumulative total) |
||||||
|
Revenue from sales |
||||||
|
Other income |
||||||
|
other expenses |
||||||
|
Percentage to be paid |
||||||
|
Net income (loss |
||||||
|
Net income for the quarter |
In the "Instructions", when studying the data of the aggregated balance sheet, it is proposed to analyze the main trends in the change in absolute financial indicators. The main task of an employee of the Financial Analysis Department is to identify the causes of these trends, as well as to study the impact of these reasons on the possibility of fulfilling obligations to the Bank in the future.
At the first stage, an analysis was made of the dynamics and structure of the capital of Tav Oil LLC with the calculation of absolute and relative changes. Table 2.3. a horizontal analysis of the aggregated balance sheet of JSC "Tav Oil" is given. For the analyzed period (from 01/01/2012 to 01/01/2013) the company's balance sheet total increased by 27.3 million rubles. or 44%. In the 4th quarter compared to the 3rd quarter of 2012, the balance sheet total increased by 24.2 million rubles. or by 36.8%. As of 01.01.2013, the company's capital structure is dominated by working capital in assets and short-term liabilities in liabilities. At the same time, the company's capital structure is balanced in terms of the terms of attraction and placement of funds. The value of own working capital amounted to 34.7 million rubles. and increased compared to the beginning of the reporting year by 5.7%. Thus, at the expense of investment resources (own capital and long-term obligations) 53% financed working capital. Net assets(represented by the company's equity) increased by 5% year-to-date, driven by an increase in retained earnings. As of January 1, 2013, it amounted to 99.9% of the total capital and reserves.
Table 2.3 - Analysis of dynamics key indicators Tav Oil LLC:
|
Index |
Change per year |
Quarterly change |
|||||
|
Balance currency |
|||||||
|
Capital and reserves |
|||||||
|
Including retained earnings (loss) |
|||||||
|
Fixed assets |
|||||||
|
VAT on purchased assets |
|||||||
|
Accounts receivable |
|||||||
|
Short-term financial investments |
|||||||
|
Cash |
|||||||
|
Other current assets |
|||||||
|
Total current assets |
|||||||
|
Loans and credits long-term |
|||||||
|
Total non-current liabilities |
|||||||
|
Credits and loans short-term |
|||||||
|
Accounts payable |
|||||||
|
revenue of the future periods |
|||||||
|
Total current liabilities |
|||||||
|
Sales revenue (cumulative total) |
|||||||
|
Average monthly sales revenue |
|||||||
|
Cost of goods sold |
|||||||
|
Revenue from sales |
|||||||
|
Other income |
|||||||
|
other expenses |
|||||||
|
Percentage to be paid |
|||||||
|
Net income (loss |
|||||||
|
Sales revenue for the quarter |
|||||||
|
Average monthly revenue per quarter |
|||||||
|
Net income for the quarter |
To represent the change in the structure of capital as of 01/01/2013 compared to 01/01/2012, table 2.4 was constructed, showing changes in current and non-current assets, capital and reserves, long-term and short-term liabilities. From table 2.4. it can be seen that, compared with the first quarter, current assets increased by 27,342 thousand rubles. and short-term liabilities for 25,334 thousand rubles.
Table 2.4 - Structure of capital at the beginning and end of 2012
|
Capital structure as of 01.01.2012, thousand rubles |
Capital structure as of 01.01.2013, thousand rubles |
Change thousand rubles |
Change % |
|||
|
Fixed assets |
Fixed assets |
|||||
|
current assets |
current assets |
|||||
|
Capital and reserves |
Capital and reserves |
|||||
|
Short-term liabilities |
Short-term liabilities |
|||||
|
long term duties |
long term duties |
Diagrams were also constructed showing the specific weights of balance sheet items in relation to the balance sheet currency at the beginning and end of 2012. Diagrams are presented in figures 2.2. and 2.3. From the diagrams below, it can be seen that the share of balance sheet items in 2012 changed slightly: the share of equity decreased by 6%, the share of short-term liabilities increased by 14%, the share of long-term liabilities decreased by 8%.
Rice. 2.2. Capital structure at the beginning of 2012
Rice. 2.3. Capital structure at the end of 2012
At the second stage of the analysis, an analysis of the structure of the enterprise's assets was carried out. The "Instruction" indicates that the mutual value of various groups of assets and liabilities depends on which industry the given enterprise belongs to. So, for trading companies (which is the company in question), the share of current assets is usually 70 - 95 percent, and the share of attracted sources of funds is similar. The company Tav Oil LLC has current assets for the reporting quarter equal to the balance sheet currency.
After the appropriate grouping of balance sheet items, the relative change in various groups of assets and liabilities over the past few quarters was assessed: whether there was a change in the share of any of the sections of the balance sheet or a group of items by more than 10%. In this case, from table 2.5. you can see that there are no such changes.
Table 2.5 - Structure of assets of Tav Oil LLC for 5 quarters
The main share in the structure of the company's assets is occupied by accounts receivable, which is formed mainly at the expense of buyers' debt (36.6 million rubles or 44% of the total accounts receivable). There are no overdue receivables.
Accounts receivable turnover was 36 days (against 35 days in the same period last year). It should be noted that the company is a net creditor in settlements - accounts receivable exceeds accounts payable by 4.9 times (84,093 thousand rubles against 17,155 thousand rubles). financial market, financial assets which is greater than the liabilities.
As part of the analysis of assets, an analysis of the receivables of the enterprise was carried out. The "Instructions" noted that special attention should be paid to changing the structure of working capital: whether there was an increase in receivables or not, whether the level of raw materials stocks is sufficient for the operation of the enterprise, whether there was an overstocking of warehouses with finished products. It is also necessary to identify dependence on one or a certain range of debtors, which may also lead to a decrease in solvency. When analyzing the composition of accounts receivable, it is necessary to pay attention to the timing and reality of its repayment. To do this, it is necessary to obtain a detailed breakdown of receivables up to the names of direct debtors and clarify their solvency. A breakdown of receivables, from which the share of the largest debtor can be distinguished, is presented in table 2.6.
Table 2.6 - Breakdown of accounts receivable of Tav Oil LLC as of 01.01.2013
|
Name of the debtor |
Debt, thousand rubles |
||
|
TSB Broker |
|||
|
North Sea Heating Networks |
|||
|
Help-Oil LLC |
|||
|
Pitkyaranta Pulp Mill LLC |
|||
|
OOO Nesto |
|||
|
Stroykomplektservis |
|||
|
TopTradeService LLC |
|||
|
OO Prima-Oil |
|||
|
Total accounts receivable: |
Accounts receivable of MUE "Severomorskie teploseti" is overdue, the date of occurrence is 28.06.2010. The largest debtor is TSB-Broker, 19% of the total debt. The second largest debtor is Severomorskiye Teploseti, 12% of the total debt. The remaining debtors have debts of less than 10% of the total amount. After analyzing the largest debtors, one should proceed to the analysis of the largest counterparties - buyers. In this regard, an analysis of the balance sheet of the company on account 62 was carried out in order to identify the main buyers. The data are presented in Table 2.7 below.
Table 2.7 - Analysis of relationships with buyers for the 4th quarter. 2012 (in thousand rubles):
|
counterparty |
Turnover according to OSV 62 c. |
||
|
Stroykomplektservis |
|||
|
metropolis |
|||
|
pulp mill |
|||
|
Impulse Oil |
|||
|
TopTradeService |
|||
The main buyer of the company in the 4th quarter of 2012. were Help-Oil and Stroykomplektservis - 40% and 9% each of the total products sold. There are no financial investments in the company. There are no investment (non-current) assets of the company as of 01.01.2013. As in the same period last year (01.01.2012 - 99.8%), current assets prevail in assets (100%), including accounts receivable (93.3%) that account for the largest share.
The next stage of the analysis was the analysis of the structure of liabilities. The analysis of liabilities was carried out on the subject of tension of the borrower's liabilities. A significant share of the borrower's own capital, the availability of long-term sources of financing indicates the stability of the enterprise. Table 2.8 was constructed, reflecting the structure of liabilities. The share of borrowed funds in liabilities at the beginning of 2012 was 47%, at the end of 2012 it was 61.5%. Equity capital at the beginning and end of 2012 had shares of 26% and 19.5%, respectively.
Table 2.8 - Structure of liabilities of Tav Oil LLC for 5 quarters
The company's long-term liabilities accounted for 19% of all liabilities at the end of the period. AT reporting period they were represented by long-term loans of the company's founders. Borrowings increased by 6% compared to the beginning of the year (compared to the 2nd quarter of 2012, this figure did not change).
The structure of the company's short-term liabilities in the analyzed period changed towards an increase in the share of short-term borrowings (bank loans) - from 21% to 42.4% - and a decrease in the share of accounts payable - from 25% to 19.0%. At the same time, the amount of short-term borrowings increased in the reporting period by 21.4%, and accounts payable - decreased by 5.6%. Short-term borrowings as of 01.01.2013 were formed exclusively from loans from Bank International JSC.
Next, an analysis of the company's accounts payable was carried out. The assessment of accounts payable was carried out in order to analyze the financing of activities through deferred payments and its impact on the solvency of the borrower. Accounts payable in absolute terms remained virtually unchanged, however, there were changes in its structure: the volume of debt to suppliers increased (38% against 12% at the beginning of the year), the volume of debt to buyers on advances received significantly decreased (11% against 64% at the beginning of the year). ), the share of the company's debt to personnel increased (29% against 6% at the beginning of the year). The debt is short-term, current.
Table 2.9 - Breakdown of accounts payable of Tav Oil LLC as of 01.01.2013
The turnover of accounts payable is high, the turnover period is 7 days (against 9 days - in 2012). The largest creditors of the company are Gazneftekhimpererabotka LLC - 45% and Sovex CJSC - 13% of the total debt. The presence of a creditor who has more than 10% of the debt should be noted as a risk for the Bank. In addition to accounts payable, it is also necessary to analyze the relationship with suppliers, that is, the balance sheet for account 60. Table 2.10. calculation results are presented.
Table 2.10 - Analysis of relationships with suppliers for the 4th quarter. 2012 (in thousand rubles):
|
counterparty |
Turnover according to OSV 60.1 sch |
||
|
Help-Oil |
|||
|
ABC-Continent |
|||
|
TriTon Trade |
|||
|
TSB Broker |
|||
|
Gas petrochemical processing |
|||
|
ForteInvest |
|||
|
Surgutex |
|||
According to the balance sheet for account 60, the main suppliers of the company in the 4th quarter of 2012 were Help-Oil LLC (41% of the total turnover), ABC-Continent (19% of the total turnover). The presence of a supplier whose share exceeds 10% by 4 times creates a certain risk of insolvency for the Bank.
Thus, the structure and dynamics of the company's capital in the reporting period testifies to the following characteristic features of its work:
the company operates mainly on short-term borrowed funds, although the growth of profit contributes to the growth of its own sources of financing, and the growth of long-term investments of the founders contributes to the balance of the overall capital structure;
the placement of funds is carried out mainly in receivables, the turnover rate of which remains at a fairly high level;
in the calculations the company acts as a net creditor, this may cause a decrease in the level of profitability in the future, which is confirmed by a slowdown in net profit growth in 4Q 2012.
The final step in the analysis of financial statements in accordance with the "Instructions" is the analysis of the main financial ratios. Based on the coefficients obtained, they were studied as part of a general analysis of the financial condition of the borrower. An analysis of the dynamics of estimated financial indicators was made with the identification of the reasons for their change, trends in the deterioration of solvency and financial stability, taking into account the risks of the Bank when lending to this enterprise. The data obtained are presented in Table 2.11.
Table 2.11 - Analysis of the main financial ratios
|
Coefficient name |
Calculation of the indicator |
Acceptable values |
||||||
|
Net assets, thousand rubles |
WB - long-term and short-term borrowings + deferred income |
|||||||
|
Current liquidity ratio (coverage) |
Current assets / Short-term liabilities |
|||||||
|
Financial Independence Ratio |
Equity / Total liabilities (WB) |
|||||||
|
Ratio of own and borrowed funds |
Equity / Total Liabilities |
|||||||
|
Inventory turnover, days |
Inventory Amount / Daily Sales Volume |
|||||||
|
Accounts receivable turnover, days |
Amount of accounts receivable / Daily sales volume |
|||||||
|
Accounts payable turnover, days |
Amount of accounts payable / Daily sales volume |
|||||||
|
Return on sales (%) |
Profit from sales / Proceeds from sales |
|||||||
|
Operational profitability (%) |
Net profit for the last reporting quarter / proceeds from the sale of goods, products, works, services for the last reporting quarter |
|||||||
|
Cash coverage ratio, in months |
The amount of credit obligations as of the current date + the requested amount of the loan product / average monthly. revenue |
|||||||
|
Interest coverage ratio |
Quarterly profit from sales for the last reporting quarter / (the amount of interest on loans and borrowings paid for the last reporting quarter + the average quarterly amount of interest on the loan product in question). |
The liquidity of the company in the reporting period is characterized by the full provision of short-term liabilities with both current and highly liquid current assets. During the analyzed period, the current liquidity ratio has not changed and is at a level significantly exceeding the normative value (more than 0.5).
The financial independence ratio and the ratio of own and borrowed funds are at the level (and higher) of the standard value (more than 0 and more than 0.4, respectively).
For 12 months of 2012, the company's revenue (on an accrual basis) amounted to 844 million rubles. or 38% of the same period last year. For the 4th quarter of 2012 quarterly revenue reached its maximum value compared to the levels of other quarters, starting from 01.10.2011. For the 4th quarter, revenue increased by 23% compared to the level of revenue for the same period last year.
The company's activity is profitable, the profit from the main activity increased by 47% compared to the same period of the previous year. Accordingly, the profitability of sales (the share of profit from sales in revenue) also increased: from 0.7% to 0.8 in the third quarter, but in the fourth quarter the profitability fell to 0.7%.
The improvement in profitability of sales in the third quarter did not lead to an increase in the level of profitability of the business as a whole. For 9 months of 2012, the profitability of the company's activities decreased and amounted to 0.1%, while in the same period of the previous year, the profitability was 0.3%. This was due to the following reasons: the amount of interest payable to the Bank increased 2 times and...
Similar Documents
Interpretation of the concept, methods and models for assessing the creditworthiness of borrowers. Conclusion on the possibility of issuing a loan by a bank on the example of JSCB Stella-Bank. Assessment of the creditworthiness of borrowing organizations. Calculation of liquidity and solvency indicators.
thesis, added 02/07/2015
Normative-legislative regulation and economic essence of creditworthiness of borrowers. Creditworthiness assessment based on business risk. Calculation of the assessment of the quality of borrowers of legal entities and individuals. Improvement of scoring assessment.
thesis, added 04/16/2011
Definition of the concept, study of the goals and disclosure of the tasks of credit scoring as a tool for assessing the creditworthiness of individuals, its prospects in Russia. Construction of a scoring model for assessing the creditworthiness of customers on the example of HKF Bank LLC.
term paper, added 08/07/2013
The concept of creditworthiness goals and objectives of assessing creditworthiness. Methods for assessing the borrower's creditworthiness. Bankruptcy diagnostic models. Analysis and ways to improve the assessment of the creditworthiness of the borrower enterprise on the example of JSC "Pokrovsky bread".
term paper, added 06/14/2015
The essence of creditworthiness and its significance. Information base and stages of creditworthiness assessment. Assessment of the creditworthiness of potential borrowers of a commercial bank based on financial ratios, cash flow and business risk indicators.
test, added 11/10/2015
Creditworthiness assessment based on a system of financial ratios. Business risk analysis. Credit indicators used by foreign commercial banks. Analysis of indicators for assessing the financial position of the borrower of OJSC "Donkhlebbank".
term paper, added 10/21/2011
The concept and purpose of the process of determining the creditworthiness of a bank borrower, the procedure, criteria and methods for its assessment, general approaches to implementation and analysis. Activity characteristics National Bank"Trust", analysis of the creditworthiness of legal entities.
term paper, added 01/25/2010
Methods for assessing the creditworthiness of legal entities and individuals. Scoring (point) assessment of creditworthiness and underwriting. Organization of the process of assessing the creditworthiness of borrowers - individuals - by the Savings Bank of Russia on the example of a mortgage loan.
thesis, added 02/25/2015
The concept, essence, criteria and methods for assessing the creditworthiness of corporate borrowers. The system of providing bank loans to legal entities. Analysis of the methodology for assessing the creditworthiness of legal entities. Credit terms approved by the bank.
term paper, added 11/13/2013
Regulatory aspects of assessing creditworthiness in the Russian Federation. Comparative evaluation of methods for assessing the creditworthiness of bank borrowers. Organization of work on credit risk management. Assessment of the creditworthiness of a legal entity. Risk reduction methods.