Comparative analysis economic development regions and the forecast of their evolution are this moment actual tasks of science and practice of the Republic of Belarus. The region as a complex territorial entity involves an analytical review of a large amount of information. The system of national statistics provides science with a large set of data, however, for cross-country and inter-regional comparisons, some specific indicators are needed, for example, gross domestic product (GDP) and gross regional product(GRP). GDP is central macroeconomic indicator, on the basis of which, in essence, the system of national accounts (SNA) is built. At the level of the Republic as a whole, the methodology for calculating GDP has been introduced since 1993, this is the so-called SNA-93.
However, recent research in the field regional economy and its sustainable development show that the analysis of existing statistical indicators only at the republican level is insufficient to describe the underlying causes and features of functioning national economy. For an in-depth analysis of the regional economy of the Republic of Belarus, it is required to rely on the world experience of territorial administration, the work of domestic and foreign scientists.
For example, N.E. Tochitskaya evaluates the competitiveness of the regions of Belarus on a number of official statistical indicators, noting that it is generally accepted to measure the competitiveness of regions on the basis of GRP. The famous Russian economist A.G. Granberg points to the special value of GRP as an indicator of regional analysis. A.P. Pankrukhin in his book “Marketing of Territories” considers the GRP indicator as a means of assessing the development and attractiveness of regions. G. Gozhelyak, B. Yalovetsky, A. Evtukhovich evaluate the competitiveness and level of development of Polish regions using GRP per capita. At the same time, the use of such indicators at the regional level in our country is just beginning.
- Methodology for calculating GRP based on available statistical information.
Within the framework of this article, we consider it necessary to dwell on the analysis of the possibilities of calculating and applying the gross regional product (GRP) indicator as the most important indicator of the competitiveness and economic development of a particular region. GRP is an indicator similar to GDP, but determined at the regional level. Today, the GRP indicator in the Republic of Belarus is not calculated authorities statistics, while Russian Federation this experience already exists. It can only be noted that certain theoretical studies are being carried out at the Research Institute of the Ministry of Statistics and Analysis, there are author's calculations of GRP for certain regions of the Republic of Belarus.
For example, G.N. Plaksina in her dissertation research carried out the calculation of the gross regional product for the Mogilev region (in the author's wording) in three main ways, defined in the system of national accounts (SNA). However, all of them are described without specifying the reporting forms and the specifics of calculating the final indicator. It should also be mentioned the article of the scientific team composed of N.Ch. Bokuna N.N. Bondarenko, Yu.Yu. Gnezdovsky "Trial calculations of the gross regional product in the Republic of Belarus". Its advantages include the presence detailed description the sequence of the calculation of the GRP of the Grodno region, indicating the sources of data and the specifics of the calculation for individual industries.
Kosterova and N.G. Berchenko in their work criticize the GRP for the lack of a unified methodology for calculating the indicator, the high costs of collecting and processing the material. The authors used about 60 reporting forms and performance reports local budgets. But the article does not describe the calculation methodology, only specific values of the GRP of the region and districts are given, some conclusions on the peculiarities of calculating the indicators.
We agree with the statement that GRP is not the only general indicator that reflects the state of the region's economy. An important remark can be considered about the specifics of accounting for the activities of regional organizations. Currently, some of this information is a trade secret. This makes it necessary to recognize the fact that the final value of the GRP of the region will differ from the sum of the GRP of all its constituent regions.
Taking into account the peculiarities of statistical accounting in the Republic of Belarus, the list of reporting forms being developed and the indicators contained in them, we can conclude that it is possible to calculate GRP at the level of a region or districts using the production method. Gross regional product calculated using the production method should reflect the total product produced by all enterprises and organizations in the region.
According to the SNA methodology, when calculated by the production method, GDP is equal to the difference between the output of goods and services in the country as a whole and intermediate consumption or the sum of value added created in the sectors of the economy. At the same time, according to the methodology of the SNA, the volumes of value added are calculated by industry in basic prices. For businesses and organizations, intermediate consumption in value terms thus represents part of the cost.
Ideally, to calculate the GRP of a particular region, it is necessary to summarize the data in terms of sectors (industries) related to this region. However, the existing method of accounting for the data of the "Households" sector does not allow to single out indicators at the level of individual regional districts. In addition, activity accounting individual entrepreneurs carried out by the statistical authorities on a non-permanent basis. Volume Data entrepreneurial activity are in the regional unions of entrepreneurs, which makes it even more difficult to obtain information. As a result, the "Households" sector is not taken into account when calculating the GRP for the region and districts. For other sectors, information is more readily available.
Methodology, systematization and uniformity of forms of statistical and financial reporting allow us to conclude that the total of GRP indicators calculated for regions or districts
There are either no such data at the regional level, or their distribution across individual regions is difficult and expensive. Therefore, analyzing similar data at the level of the Republic of Belarus, we can say that their absence in the GRP indicator will not entail fundamental changes.
In turn, the GRP indicator obtained as the sum of the GRP of individual districts will be less by the part of the GRP produced by regional organizations.
Since one of the main goals of substantiating the methodology for calculating GRP is to ensure economic feasibility, based on the foregoing, we can propose:
- Read form No. 5-3 "Report on the costs of production of products (works, services)", and form No. 1-MP "Report on financial and economic activity of a small business entity” are the main ones for calculating GRP, since the performance indicators of enterprises in these forms are taken into account in the sectoral context. The use of uniform reporting forms for all industries makes it possible to reduce the costs of collecting and processing information, and practically eliminates the possibility of double counting.
- Do not include data on the activities of organizations of republican significance in the GRP of the district.
- Consider the “Local Budget Execution Report” as the main reporting form for calculating output and intermediate consumption indicators budget organizations.
For budgetary organizations and funds, according to our calculations: B = Costs for the purchase of goods and services + Consumption of fixed capital.
The source of information on the expenditures of budgetary organizations, budgetary and off-budget funds is the "Report on the execution of local budgets". This form does not take into account the consumption of fixed capital of budgetary organizations and funds. As a source of such an indicator, you can use either form No. 1 - “balance sheet” filled out by budgetary organizations, or summary reports “On the presence and movement of the main and working capital budgetary organizations of the region” regional departments of statistics.
The indicator of consumption of fixed capital is calculated as the difference between the amount of depreciation of fixed assets at the end and beginning of the year (in last years depreciation of fixed assets is called "depreciation").
Gross Regional Product (GRP) - summarizing indicator economic activity region, characterizing the process of production of goods and services.
Gross regional product (GRP) - an indicator that measures gross value added, calculated by excluding the volume of its intermediate consumption from the total gross output, is defined as the sum of newly created values of the region's economic sectors.
At the national level, the gross regional product (GRP) corresponds to the gross national product, which is one of the basic indicators of the system of national accounts.
There are several methods for calculating GRP . Gross regional product at the stage of production, calculated by the production method, is the sum of the gross value added created by all resident institutional units in the economic territory of the region (excluding net taxes on products).
It is calculated at the level of industries and sectors using the production method as the difference between the output of goods and services and intermediate consumption, formed from the value of goods and services that are transformed or completely consumed in the production process. The term "gross" indicates that the figure is determined before deducting the consumption of fixed capital.
Gross regional product is calculated in current basic and market prices(nominal volume of gross regional product), as well as in comparable prices (real volume of gross regional product).
The indicator of the gross regional product is, in its economic content, very close to the indicator of the gross domestic product. However, there is a significant difference between the indicators of gross domestic product (at the federal level) and gross regional product (at the regional level).
The sum of gross regional products for Russia does not coincide with GDP, since the calculation of GRP does not take into account a number of elements that include GDP. Therefore, the total GRP of all regions of Russia is less country's GDP.
Let's list elements not taken into account when calculating the gross regional product (GRP) :
Value added of industries that provide collective non-market services to society as a whole ( public administration, defense, International activity etc.);
- added value of services of financial intermediaries (primarily banks), whose activities are rarely limited to strictly individual regions;
- added value of services foreign trade, which in many cases can only be obtained at the federal level;
- part of taxes (taxes on import and export), which cannot be taken into account at the regional level.
As for the first point of the considered elements, conceptually, these services should be accounted for at the place of their production (provision), and their value should be included in the volume of GRP of the corresponding region.
The volume of these collective services is determined in the amount of the corresponding costs state budget reflected in the performance report federal budget. All federal budget expenditures in the regional context should be taken into account and reflected by the system of regional treasuries in accordance with the current unified budget classification. But the practice of accounting for some federal budget expenditures for the country as a whole, without breaking down into individual regions, continues to this day.
This is mainly due to the inability to determine to which specific region the costs incurred can be attributed (for example, budget expenditures for international cooperation, servicing public debt etc.), as well as continuing shortcomings financial accounting or some political considerations (defense spending, internal affairs, etc.).
Thus, the presence of problems associated with the distribution of part of the public spending, as well as overcoming the shortcomings of regional accounting (incomplete reflection of data in the reports of treasuries) currently force them to abandon their accounting at the regional level.
In addition, among the positions that determine the discrepancy between the gross domestic product as a whole and the sum of gross regional products for all territories, include indicators that reflect financial and foreign trade intermediation.
The production of financial intermediary services in modern conditions is very difficult to correctly account for the regions. Due to the specifics banking it is problematic to tie its volume to one region where the bank is registered. A bank may be registered, for example, in Moscow or have only a branch here, which, as a rule, conducts a large volume of operations, but at the same time, a Moscow bank or a Moscow branch of a provincial bank today can actually provide financial intermediation in almost the entire territory of Russia. As a result, the territorial statistical bodies have practically no data in order to accurately estimate the production financial services on the territory of the region.
Such an element of the calculation of GDP as “indirectly measured services of financial intermediaries” also does not seem possible to be distributed among individual territories. As is known, according to the SNA methodology, the cost of these services is included in the intermediate consumption of their recipients. But the issue of attributing the cost of financial intermediary services to the intermediate consumption of specific consumers of these services has not yet been resolved even theoretically, their volume is measured indirectly as a whole and, accordingly, is not distributed either by industry or by territory.
At present, accounting for the interregional exchange of goods and services is a big problem in regional calculations, which makes it impossible to account for the value added of foreign trade for the region with a satisfactory degree of reliability.
It is obvious that the volume of net taxes on imports under the current conditions can only be estimated as a whole for the economy without distribution by regions. It is practically impossible to determine the territorial structure of either taxes or subsidies on imports, since there is no information on the territorial distribution of the imports of goods themselves.
Certain problems are also associated with the regional accounting of net taxes on products. They are due to insufficient information in the budget. In particular, to calculate net taxes by region, it is necessary to present the regional distribution of subsidies for products paid from the federal budget.
In full, such data are not available not only in regional statistics, but also at the federal level, since a certain part of subsidies for products is distributed by the Ministry of Finance of Russia not to the regions, but is transferred to ministries and departments for the development of the relevant industry, and only then gets to enterprises through departmental distribution . It is practically impossible to trace the entire path of such subsidies to the regions, so for a certain part of net taxes on products, it is possible to do only overall score on the economy as a whole.
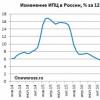
Thus, due to a number of methodological and organizational reasons a number of important positions of GDP can only be calculated at the federal level for the economy as a whole, and the amount of GRP throughout Russia is objectively less than GDP . The objectively substantiated discrepancy between GDP and GRP was 12.6 percent in 2002.
Starting from the results for 2004, data on the gross regional product (GRP) are published on the official website Federal Service state statistics in basic prices, earlier the publication of data on GRP was carried out in market prices.
Currently, Russia is actively implementing DIS PDNS (Two-level Integrated Data Preparation System for National Accounts). Already in 2007, the GRP was calculated with the introduction of the DIS PDTS, which made it possible to carry out additional monitoring of indicators and data collection. Unfortunately, until recently, the DIS PDNS has not outgrown the stage of trial operation and is an unresolved tangle of conflicts in setting problems in various statistical forms.
In 2010, the development of DIS PDNS was transferred to a new contractor (Tver Inform Product), which limited itself to redesigning the old program, passing it off as a completely new software package.
Unfortunately, the calculation of the GRP of the subject of the federation is 28 months behind. For example, data on GRP for 2007 appeared on the official website of the Federal State Statistics Service in March 2009.
Page 2 of 2
The indicator - gross regional product (GRP) - is used to characterize the results of production in the region, to assess the level of economic development, economic growth rates and analyze labor productivity. Total GRP is the value of all final goods and services produced in a region in a year. According to the Keynesian model, the total GRP is calculated using the following formula:
WRP = C + I + S + E - M, (1)
where, C - consumption; I - investments; S - regional and municipal expenses; E - export; M - import.
Formula (1) shows what depends on the economic growth in the country and how it can be influenced. The main source of GDP growth are consumption (C) and investment (I). In order to stimulate consumer demand and investment levels, central bank reduces interest rates and the government cuts taxes. An increase in regional and municipal spending (S) also leads to an increase in GDP. To analyze labor productivity and compare regions, GRP per capita is used, which is determined by dividing the total GRP by the population of the region. We considered 80 regions of Russia for 2012-2013. .
As a result of using the principal component method greatest influence have specific factors: I, C, S, E, M, which are arranged in descending order of variations. Variation refers to the variance and standard deviation. Influencing factors are independent indicators on the right side of the equation.
For the total GRP, the following regression equation was constructed, which is significant at the 5% level:
GRP= exp(5.136+0.000001 INV_OK+0.000076 UCH-0.000307 ACP+0.0095 DOC-0.00008 Z_NIR +0.000013 Z_TEHN) with correlation coefficient R = 0.82,
where INV_OK is the volume of investments in fixed assets; UCH - the number of personnel involved in scientific research; ACP - admission and graduation from doctoral studies: DOC - admission and graduation from doctoral studies: Z_NIR - research costs; Z_TEHN is the cost of technological innovation.
A positive effect is an increase in INV_OK, UCH, DOC, Z_TEHN. The greatest effect is brought by the increase in the number of doctors of sciences.
Specific income in the regions of Russia was considered in the article. The regions were divided into clusters. All regions were divided into 4 classes. For each cluster, significant regression equations were constructed.
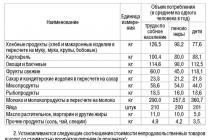
The influence of per capita food consumption in the regions was considered in the article. In the constructed regression equation, the factors that have a positive effect on GRP per capita are: the average per capita annual consumption of meat, milk, vegetable oil, potatoes and vegetables. Factors that have a negative impact on GRP are: the consumption of eggs, sugar and bread.
Comparison of the state of education and gross regional product is considered in the article. According to the constructed regression equation, we can draw the following conclusions: with an increase in the number of students by 1 person out of 10 thousand people, the specific value of GRP per capita in the region will increase by 11.5 rubles; with an increase in investment in education by 1 ruble for each inhabitant of the region, the specific value of GRP will increase by 16.3 rubles. With an increase in investment in education in "average-income" regions by 1 ruble, the GRP per capita increases by 11.69 rubles.
Equations for demographic indicators depending on income and GRP are given in the article. The article provides clustering of regions by the share of the active population, the unemployed, the share of employees and average per capita income. The volumes of exports and imports in the regions slightly affect the GRP, which can be observed from the coefficients of the constructed regression equation:
GRP = exp(5.064-0.00323 IND_P+0.0013 IND_CX+0.000001 E-0.000002 M-0.0112 INF +0.0244 UEA) (2)
with correlation coefficient R = 0.75,
where IND_P is the index industrial production; IND_CX - index of agricultural production; E - specific export; M specific import; INF - inflation index; UEA - Level economic activity population.
The regression equation (2) is significant at the level of 0.05, but the residuals of the equation (the difference between the values of the equation and the statistical data) do not follow the normal distribution law.
Literature
- Plotnitsky, M.I., Lobkovich E.I., Mutalimov M.G. and etc. Macroeconomics: Tutorial. M.: New knowledge, 2002. 462 p.
- Regions of Russia. Socio-economic indicators. 2013: Stat. Sat. // Rosstat. M., 2014. 990 p.
- Magnus F.R., Katyshev P.K., Peresetsky A.A. Econometrics: Textbook. M.: Delo, 2005. 504 p.
- Ignatiev V.M. Income and demographic indicators of the population in the regions // Economics. Control. Finance: Sat. articles. Kyiv: Economist. 2013. S. 68-72.
- Ignatiev V.M. Consumption of food products by the population of the regions // Strategy for sustainable development of regions of Russia: coll. articles. Novosibirsk, 2015. No. 25. P. 132–137.
- Ignatiev V.M., Eroshina E.A., Zemkova A.S. Comparison of the state of education and gross regional product / Development of scientific thought in modern world: topical issues, prospects, innovations: Sat. articles. Rostov-on-Don: SIC "Summa-Rerum", 2014. P.78-83.
- Istomina K.S.
- Ignatiev V.M., Bakanova S.A. Polarization of Russian regions in terms of employment and income of the population // Nauka i inowacja. Pezemysl: Nauka i studia. 2013. Vol. 3. P. 15-18.
- Ignatiev V.M., Borisova D.M. Forecasting the employment of the population of the region // Science, technology and education. 2015. No. 3(9).C. 40-43.
- Ignatiev V.M., Chebotareva A.Yu. Factors of innovation and its Ishikawa diagram // Science, technology and education. Ivanovo, 2014. No. 4. P. 21–24.
- Istomina K.S. Influence of indicators on the birth rate in the regions. Vestnik nauki i obrazovaniya. 2015. No. 2(4). C. 60-64.
As noted above, the main macroeconomic indicator of the performance of the economy in the statistics of many countries, as well as international organizations(UN, OECD, IMF, etc.) is GDP. At the micro level (enterprises and sectors) GDP corresponds to the indicator newly created “gross value added”, reflecting the end result of their production activities. To characterize the process of production of goods and services at the mesolevel (region, krai, oblast), in accordance with the general methodological approaches of the SNA, the gross regional product is calculated.
Gross regional product- This is a general indicator of the economic activity of the region, characterizing the process of production of goods and services. GRP(or "our work") is equal to the sum of the value added of the sectors of the economy of the region, calculated as the difference between output and intermediate consumption ("someone else's work") plus net taxes on production and imports.
GRP calculated at current basic and market prices (nominal GRP), as well as in comparable prices (real GRP). GRP- this is a fundamentally new aggregate indicator for Russia, which has not previously been used in the practical activities of the country and regions. Its main conceptual feature is that it takes into account any activity and stimulates "our" labor of all enterprises. Avoid double billing and costs at the same time "foreign" labor, which were previously taken into account in the total volumes and results of assessing the effectiveness of production.
GRP \u003d S BB - S PP + S NNP + S NNI;(4.4.)
The methodology for calculating this indicator for most sectors and industries at the regional and federal levels is the same.
However, there is a significant difference between the calculations GDP at the federal level and settlements GRP at the regional levels. Individual components GDP at the federal level, for objective reasons, it is impossible to spread across the regions (expenses for the maintenance of the Presidential Administration, the Government, State Duma, Ministries, etc.), they are calculated centrally and are included only in GDP Russia as a whole. That's why GRP amount all subjects of the Russian Federation is not equal GDP.
Gross value added in basic prices, calculated for all constituent entities of the Russian Federation, differs from the gross domestic product of Russia by the amount of value added created only at the federal level. Therefore, the total GRP of all regions is less than the country's GDP by a number of elements that are not taken into account:
Value added of industries that provide collective non-market services to society as a whole (public administration, defense, academic science, etc.);
Value added of industries providing individual non-market services, if information on expenditures for these services is not available at the regional level;
The imputed cost of financial intermediary services (FISIM);
Some taxes, in particular - taxes on imports, which cannot be taken into account at the regional level.
In addition, it is technically impossible and methodologically unjustified to distribute non-market collective services between individual regions, and there are no data for an adequate distribution of value added by the subjects of the Federation, created by financial and foreign trade intermediaries. The value of the discrepancy between the amount of GRP in the subjects of the Federation was, according to our estimates, in 2000-2006 less by 12-13% of the total value of GDP.
Russia has adopted the following scheme for calculating regional indicators based on the uniform methodological principles of the SNA. Territorial bodies of state statistics are entrusted within the framework of federal program collect information on unified reporting forms and annually calculate aggregated indicators of regional accounts in the SNA.
The data of GRP calculations are constantly checked by Rosstat, and the official results for the regions are approved by them after a four-fold clarification of the data after 2 years. It is clear that interest in them on the part of the authorities is declining.
Table 4.10.
Gross regional product
(per capita)
| Region | |||||||||
| thousand roubles. in current prices | |||||||||
| Russia | 39,5 | 49,5 | 60,6 | 74,9 | 97,9 | 126,0 | 157,9 | 198,8 | 248,0 |
| Ural county | 69,3 | 90,1 | 107,8 | 134,5 | 181,7 | 252,1 | 304,0 | 346,2 | 396,8 |
| Kurgan | 17,8 | 24,4 | 29,3 | 36,7 | 42,6 | 51,0 | 70,2 | 84,0 | 111,3 |
| Sverdlovsk | 34,2 | 44,1 | 52,2 | 63,8 | 82,1 | 107,6 | 148,5 | 186,6 | 214,9 |
| Tyumenskaya | 176,9 | 232,2 | 275,6 | 340,7 | 465,9 | 668,3 | 765,2 | 821,3 | 928,4 |
| Chelyabinsk | 33,0 | 39,2 | 47,8 | 61,4 | 81,7 | 98,8 | 126,8 | 163,8 | 189,5 |
Source: Yearbook of the Federal State Statistics Service М.2010 “Russian Statistical Collection”, p.335.
Modern regional leaders are especially interested in the dynamics of GRP, income, profits and savings. There are opportunities for the territory to assess: the level of development of production, the contribution of the territorial entity to the overall results of the country's economy, what resources the subjects of the Russian Federation have and how they are used.
At the same time, in a country consisting of 86 territorial-administrative entities with different geographical locations and significant differences in the levels of socio-economic development, it is difficult to objectively distribute the added value created and calculate the true production costs. Therefore, the calculation problem GRP for each region is particularly relevant.
At the regional level, the main indicators of the CDS have been calculated since 1995, and certain interesting observations have been made, and completely new results of the analysis have been achieved.
In addition to GRP, the territorial bodies of state statistics should also calculate indicators of gross capital formation, final consumption, savings, fixed capital and a number of other indicators of efficiency and intensity according to the SNA methodology.
The calculation of GRP is carried out by statistical agencies on a discrete basis by the production method, taking into account the formation information base for accounts. Two types of information are commonly used:
Direct information, which is complete or partial data on the magnitude and dynamics of calculated indicators. For example, unified form P-1 "Information on the production and shipment of goods and services" contains information on the quantity and dynamics of the industry's products. The information obtained from the reports is necessarily counted to the full circle, taking into account small enterprises, household products and the informal economy;
Indirect information, which is data on the volume or dynamics of an indicator that does not constitute a whole or part of the calculated indicator, but changes make it possible to judge the dynamics of the calculated indicator. For example, the change in the number of service persons is indirect information for determining the dynamics of the volume of services provided.
First of all, it should be noted that the indicators can be standardized, that is, calculated per inhabitant, which allows a new way to compare the intensity of data change between regions, regardless of their size and scale. This is especially important because it becomes possible to compare any subject of the Russian Federation. For example, Moscow provides approximately 10% of the total GRP of all regions of the country, the same as the Northern and Volga-Vyatka economic regions, taken together. And the contribution of the Republic of Ingushetia and Altai Territory small - less than 0.02% of GRP from each region.
Moscow, of course, stands out among other regions of the country. Per capita, the capital produces 70% more added value than the average for Russia. However, Moscow is not a champion in this indicator. Production level in Tyumen region more than two times higher than in Moscow and 3.5 times higher than the Russian average. Among the leaders in the country are the Republics of Yakutia and Komi, Krasnoyarsk region, Samara region (with its VAZ-ohm). Tatarstan and St. Petersburg are ranked 21st and 22nd respectively.
The lowest rates are in the North Caucasian republics, Kalmykia, the Republics of Altai and Tuva, as well as the Penza, Tambov, Ivanovo regions, where the level of per capita GRP production is two or even three times lower than the average level in Russia. If we compare the highest (Tyumen) and the lowest (Ingushetia) levels, the difference will be significant - more than 17 (!) times.
Approximately correspond to the average Russian levels of per capita production in the Arkhangelsk, Nizhny Novgorod, Omsk regions. It can be argued, however, that the average value of the series is somewhat shifted due to the anomalous values of Tyumen, Yakutia and Moscow, due to quite understandable geographical and administrative factors that form the characteristics of the economy of these territorial entities.
Therefore, the most typical are the indicators of GRP production in the Bryansk, Vladimir, Kaluga, Voronezh, Kirov, Volgograd, Saratov, Ulyanovsk, Kurgan and other regions. In them, per capita production indicators are somewhat lower than the average level for Russia.
Just as when calculating production indicators, when constructing other regional indicators, it makes no sense to take into account the collective services of the federal level (public administration, defense, academic science, etc.), since they turn out to be for society as a whole.
The most important indicator, which characterizes the final use of goods and services in the territory of the region, is the indicator “actual final consumption” . Households consume goods and services through own income, as well as individual non-market services of health care, education, culture, etc. at the expense of the state and non-profit organizations, transferred to households in the form of transfers in kind. This indicator is important not only in terms of comparing production and use GRP, but also studying the level of well-being of the population.
If Moscow ranks third in Russia in terms of value added per capita, then in terms of actual final consumption per capita, it confidently leads by a huge margin. It is almost 90% ahead of the Magadan region, which is second, more than three times the average level in Russia and almost 18 times the level of the Republic of Ingushetia.
However, what is certain is that Moscow is not exactly the same as the rest of Russia in terms of consumption. If we exclude from consideration the Far East regions, where final consumption costs are traditionally high due to geographical reasons, and the North Caucasian republics, where people experience additional difficulties, then the most typical level of actual final consumption will be in Smolensk, Tver, Tula, Belgorod, Voronezh, Saratov and Chelyabinsk regions.
However, in a number of territorial entities of the Urals (Kurgan, the region and the Udmurt Republic) there is a higher naturalization of production at the level of business units (enterprises), there is a significant shortage of raw materials and financial resources, the imbalance of technological structures (a large share in the economy of the military-industrial and agricultural industries). complex), the desire to simplify technologies while maintaining a significant share of manual labor. The disproportions were accompanied by the unevenness of institutional transformations, the inclusion of foreign economic relations on new, more open conditions, violation of the system of cooperation.
As a result, the existing system of territorial and sectoral division of labor turned out to be poorly adapted to market relations. The regional differentiation of the level of production, consumption and life of the population has intensified. Therefore, along with economic indicators SNA social indicators of human development should also be measured.
Statistics, as a living social science that reflects the life and activities of the population and households, is able, according to a new concept, to characterize terms life of the population, which should create for him the power. According to Art. 7 of the Constitution of the Russian Federation "The Russian state welfare state, whose policy is aimed at creating conditions that ensure decent life and the free development of man". In the same time capabilities development must be provided by the people themselves and employers. Solving the problems of saving the population and related budget expenditures is not charity and is not social help. This is an investment in human capital which are able to ensure economic growth throughout Russia.
It is proposed to take into account the peculiarities of the development of the region: socio-demographic and personnel, socio-political - to reflect conditions life of the population. And material and resource, sectoral and structural, financial and budgetary, natural and climatic, information and statistical, organizational and economic - for characterization opportunities population and businesses.
To do this, it is necessary to change the system of indicators that reflect the effectiveness of the work of personnel and the economy. Abandon the old detrimental indicator - volume production in industries that contains a double count and stimulates the growth of costs rather than the growth of value added.
It is not yet possible to get away from repeated counting in practice due to the fact that at the federal and regional levels, quantitative indicators are mainly used that characterize extensive forms of management (the volume of industrial, agricultural and other production), and qualitative indicators (GRP, profit, labor productivity etc.) as the main ones are rarely used in official publications.
All this is happening because the apparatuses of the organs of power and administration are slowly mastering SNA and SRS and do not actively use modern market indicators, generally recognized throughout the world.
From an economic point of view, it is detrimental to use volumetric and only quantitative indicators as the main ones, containing a significant share of enterprises' costs (intermediate consumption). In practice, eclecticism is being carried out, secretly stimulating costs, and the most important in market conditions data such as regional product, income, consumption, accumulation, profit, savings and many other indicators SNA are used as secondary.
Table 4.11.
GRP structure in the Kurgan region
(billion rubles / share, in %)
"Gross output" obtained by double and double counting of raw materials, materials and semi-finished products ( someone else's work ) amounted to more than 52 billion rubles in 2001, and the regional product (own work) - total 25 billion rubles. In 2008, "output" reached 250 billion rubles, and GRP - 106 billion rubles. The cost share decreased from 51% (2001) to 48% in 2008.
GDP at the stage of formation of income consists mainly of profits of enterprises, incomes of the population and taxes, at the same time, costs are not taken into account. On average, the real incomes of the population and the profits of enterprises should increase by 7-10% per year. However, the profits of the economy are growing at an insignificant pace.
Instead of expanding the “export” of products to other regions, “import” is increasing, for which you have to pay and funds are limited, there is not enough money, more and more is needed financial resources to serve "foreign" labor. This wastefulness reduces the efficiency of the entire economy of the Kurgan region and turns it into a raw materials appendage of the regions and republics of the Urals, Western Siberia and other regions of the country.
Therefore, it is necessary to move away from cost incentives and re-billing, it is necessary to use only data SNS, such as GDP, GRP, income, profit, consumption, accumulation, savings, etc. At the same time, it will be necessary to create a system of economic education SNA all state and municipal employees, specialists of enterprises, the population and the public. Such an educational program SNA organized in the Kurgan region.
test questions
1. The amount of value added of enterprises is equal or not GRP?
2. What explains the need for calculus GRP?
3. What are the features of assessment methods GRP?
4. What indicators SRS used in practice?
5. What accounts and indicators are used to reflect the activities of households?
1.4 Methods for calculating GRP. Production method for calculating GRP
GRP is the central macroeconomic indicator. It characterizes the final result of the production activity of all resident production units of a given territory for certain period time. It can be considered at the stage of production, at the stage of income generation and at the stage of use of income.
At the stage of production, GRP characterizes the added value created by residents in the current period in the process of production of goods and services.
At the stage of income generation, GRP is the amount of primary income received by residents in the production process and subject to distribution among the participants in the production process.
At the stage of using income, GRP reflects the sum of expenditures of all sectors of the national economy on final consumption and accumulation and net exports of goods and services.
Accordingly, there are three methods for calculating GRP: the production method, the method of forming GRP by income sources, and the end use method.
GRP is an aggregate measure of output. It is designed to measure the value created in the production process over a given period of time by residents of a given territory. At the core production method GRP calculations are the following indicators:
release of goods and services;
· intermediate consumption;
Gross value added.
The output (B) of a sector, industry or economy as a whole is the value of all goods and services produced in the current period by resident production units that are part of the sector, industry or national economy, respectively. Since the output of an institutional unit is made up of the outputs of the establishments it owns, the output of all sectors of the national economy is equal to the output of all sectors. It is customary in the SNA to calculate output at basic prices. The value of manufactured goods includes the value of goods and services used in the production process. In order to obtain the value newly created in the current period in the production process, it is necessary to subtract intermediate consumption from the output of goods and services. Intermediate consumption (IC) refers to the value of goods and services that are transformed or completely consumed in a given period in the production of other goods and services. It includes the following constituent elements:
· material costs(raw materials, materials, fuel, energy, semi-finished products, material services, expenses of homeowners for its Maintenance; household purchases of tools, building materials, seeds, feed for own economic activity; purchases of food and medicines by hospitals, etc.)
payment for intangible services (payment for research and experimental work, payment for financial services, expenses for training and advanced training of personnel, payment for legal services, audit, advertising expenses, rent payments for the use of production assets (buildings, structures, machinery, equipment, etc.)
travel expenses (in terms of travel and hotel services);
Other elements of intermediate consumption, including both material costs and payment for non-material services (representation expenses, expenses for warranty repairs and maintenance, expenses for the maintenance of research laboratories and bureaus, recruitment expenses, the cost of transporting employees to and from work paid by the manufacturer).
To calculate intermediate consumption, the data contained in the forms of statistical observation on the costs of production and sale of products (works, services), data from the report on the execution of estimates of income and expenditures of budgetary organizations, sample surveys of households (to obtain data on agricultural production in the households of the population) are used. and other business activities) and other sources of information.
Intermediate consumption is valued at market prices (purchasers' prices) at the time the relevant goods and services enter production. The difference between the output of goods and services and intermediate consumption is called gross value added (GVA):
GVA \u003d B - PP.
The term "gross" means that when calculating the indicator of value added, the consumption of fixed capital is not deducted from the output, which, like the value of other goods and services consumed in production, is the result of the production activities of previous periods. Consumption of fixed capital (A) is defined in the SNA as the decrease in the value of fixed capital in the production of goods and services as a result of wear and tear or normal damage. It should be calculated based on the actual service life and replacement cost elements of fixed capital, for example, based on the perpetual inventory method. If we exclude the consumption of fixed capital from gross value added, we get an indicator called net value added (NPV). It more accurately reflects the value newly created in the current period, added to the value of goods and services consumed in the production process:
NPV \u003d GVA - A.
Since output is measured in basic prices, gross value added and net value added are also valued in basic prices, including subsidies but excluding taxes on products. It follows from this that one of the components of value added are other taxes on production. The sum of the gross value added of all sectors of the national economy is equal to the sum of the value added of all sectors. To determine GRP at market prices, the amount of gross value added of industries or sectors of the economy is reduced by the amount of indirectly measured financial intermediation services. Indirectly measured financial intermediation services are the difference between interest received and paid by banks. These services are treated in the SNA as intermediate consumption. Since these services are difficult to attribute to the costs of any particular industry (sector), they are excluded from the GVA total for the economy as a whole AND are increased by the amount of net taxes on products (NPT):
GDP = NNP + GVA.
where GVA is the total value of gross value added minus indirectly measured financial intermediation services. Excluding the consumption of fixed capital from the gross domestic product, one obtains the net domestic product (NDP). In terms of net value added and net domestic product, the following are more important:
NVP \u003d GDP -A.
Distributive method of calculating GRP
At the stage of income generation, GRP can be calculated as the sum of primary income to be distributed among the direct participants in the production process. These incomes are value added components current period created during the manufacturing process. These include the following income from production:
· remuneration of employees (residents and non-residents), defined as remuneration in cash and in kind, paid by residents to employees for work performed during the current period. In this case, all amounts accrued to employees are taken into account (before the exclusion of taxes on income and other deductions from wages), as well as deductions of insurance premiums to funds social insurance and security;
net taxes on production and imports, which are government revenues. This element takes into account not only taxes and subsidies on products, but also other taxes on production, which are levied on production units as participants in the production process (excluding taxes on profits and other income);
· gross profit and gross mixed income received by residents as a result of their participation in production before settlements with other economic units for the use of borrowed financial or non-financial non-produced assets in the process of production (i.e., before the payment of dividends on shares, interest on deposits, rent for the use of land, etc.). Payments for the use of borrowed assets are called property income in the SNA. If we exclude the consumption of fixed capital from this element, then we get net profit and net mixed income.
This method of calculating GRP is used to analyze its cost structure. Not only residents of the region, but also non-residents (the rest of the world) take part in the process of distribution of primary income. Part of the primary income must be transferred to non-residents in the form of wages and in the form of income from property (dividends, interest, etc.). At the same time, residents can receive primary income from direct or indirect participation in the production of GRP in other regions, also in the form of wages and income from property. If we exclude from GRP the primary incomes transferred to the rest of the world and add the primary incomes received from the rest of the world, then we get the gross national income of the region (GNI) at market prices.
national income(gross or net) characterizes the sum of all primary income received by residents of the country as a result of direct or indirect participation in production activities both within the national economy and outside it.
Calculation of GRP by the end use method
GRP is the sum of residents' spending on final consumption, gross capital formation and net exports.
Final consumption refers to the use of goods and services to meet the individual needs of the population and the collective needs of society as a whole. The income of some institutional units can be used to finance the costs of consumer goods and services consumed by other institutional units.
Final consumption expenditure has institutional units in three sectors of the economy: households, public institutions and non-profit organizations serving households.
As part of final consumption expenditure public institutions two groups can be distinguished:
spending on individual goods and services provided to households (). They include the value of non-market services provided budget institutions health, education, welfare, culture, arts, physical education and sports, as well as the value of goods and services purchased by them to transfer to households as social benefits in kind (free medicines, textbooks, vehicles for the disabled and services for their repair, etc.);
· expenses for collective services () cover the cost of non-market services of budgetary organizations in the field of management, defense, security, science, environmental protection, etc.
Actual final consumption refers to the value of actually consumed goods and services, regardless of the source of financing. It includes:
· the value of all individual goods and services purchased by resident households (actual household final consumption);
· the value of collective services provided by public institutions to society as a whole (actual final consumption of public institutions).
For individual sectors, final consumption expenditures do not equal actual final consumption. For the economy as a whole, final consumption can be calculated in two ways:
· as the sum of final consumption expenditures of all sectors;
· as the sum of actual final consumption of households and public institutions;
In addition to final consumption expenditures, the main components of the final use of GRP are gross capital formation and net exports of goods and services. Gross capital formation covers the following three elements:
· gross fixed capital formation;
· growth of spare material circulating assets;
· net acquisition of values Purchase minus sales for each sector. At the level of the economy as a whole, the net consumption of newly produced or imported valuables.
Gross fixed capital formation is the investment of funds by resident institutional units in fixed capital objects in order to obtain economic benefits from their use in production in subsequent periods. It is expressed in the increase in the value of fixed capital of institutional units through the acquisition (minus disposal) of new and existing fixed assets. As components of gross fixed capital formation, the costs of improving non-produced tangible assets and costs associated with the transfer of ownership of non-productive assets. When calculating gross fixed capital formation, the base is data on the volume of investments in fixed capital, which are adjusted taking into account the SNA methodology.
The change in inventories includes an increase in stocks of raw materials and materials, finished products, work in progress, goods for resale, state material reserves. 


Components: final consumption of goods and services, gross capital formation, net exports of goods and services. A statistical discrepancy between the produced and used gross regional product may arise due to differences in data sources and classifications used in calculations by different methods, lack of necessary information and other reasons for objective and ...


Regions in the current conditions is impossible. However, to gradually reduce the regional asymmetry in the economy that has developed in the Russian Federation and social sphere necessary, using available financial resources. Chapter 3. The main ways to overcome the economic asymmetry in the development of the regions of the Russian Federation