Income differentiation and its causes. State socio-economic policy of incomes of the population: its role, elements, goals and methods. Income differentiation and its causes.
Share work on social networks
If this work does not suit you, there is a list of similar works at the bottom of the page. You can also use the search button
Topic 19. Incomes of the population and social policy of the state
19.2 State socio-economic policy of incomes of the population: its role, elements, goals and methods. Comparison of social economic policy in the Russian Federation in the 1990s and 2000s. and its effectiveness. Foreign experience in the field of "smoothing" the differentiation of the population by income (on the example of at least 2 countries).
19.1 Incomes of the population, their types and measurement indicators. Income differentiation and its causes. Lorenz curve. Peculiarities of population differentiation by income in Russia (2000s).
The level of well-being of people is characterized, first of all, by the receipt of income.Population incomeis the amount of money and material goods received in social production or produced by the household, or some other activity during a certain period of time.
The income of the population includes wages, entrepreneurial income, dividends on shares held by the population, interest on savings invested in a bank, rent on rented real estate, etc. The source of income for enterprises or firms is profit, interest or rent, depending on the type enterprises. However, not all profits are included in the income of enterprises. From the gross profit make external deductions. Part of the profit received by the entrepreneur becomes his personal entrepreneurial income. The rest of the profit is actually the income of the enterprise itself, which is used to expand production, train personnel, social sphere, etc.
It is income that determines our possibilities in food and clothing, in obtaining education and medical services; opportunities to visit theaters and purchase books, actively travel around the world, etc.
Incomes of the population are divided into: monetary, natural, nominal, disposable, real.
Cash income of the population include all receipts of money in the form of wages, income from business activities, pensions, scholarships, various benefits, income from property in the form of interest, dividends, rent, income from the sale of goods, income from the provision of various services, etc.
Income in kindinclude, first of all, products produced by households for their own consumption, as well as those obtained in social production.
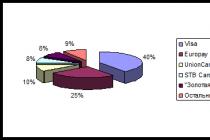
Nominal incomeThis is the total amount of money that is received over a certain period of time. Nominal incomes characterize the level of cash income, regardless of taxation and price changes (Fig. 19.1).
Figure 19.1 - Structure of nominal incomes of the population
disposable incomerepresents only that part of nominal income that can be used directly for personal consumption of goods and services, as well as for savings. In other words, disposable income is equal to nominal income minus tax contributions, mandatory payments (contributions to a pension fund, social needs, and others).
Real income reflects the purchasing power of our money income. It represents the amount of goods and services (in value terms) that disposable income can buy over a given period of time (i.e., price changes are taken into account here).
There are the followingbasic principles (types) of distribution income:
1. Equal distributionoccurs when all members of society receive equal income. This principle is characteristic of primitive society and the communist mode of production.
2. Market distributionsuggests that each of the owners of one or another factor of production (land, labor, capital) entrepreneurship receives a different income in accordance with the economic utility and productivity of his factor.
3. Distribution by accumulated propertymanifested in the receipt of additional income by those who accumulate and inherit any property (land, enterprises, houses, securities and other property).
4. Privileged distributionespecially typical for countries with undeveloped democracy and civil passive society. There, the rulers arbitrarily redistribute public goods in their favor, set themselves increased reports and pensions, creating good conditions life, work, leisure treatment and other benefits.
Whatever system of distribution is not fair, in any modern society inequality of people's incomes is inevitable.
Causes of income inequality:
1. Differences in individual abilities. People different in their intellectual, physical, creative and other abilities. These features form a different predisposition of people to the effective performance of certain types of work.
2. Differences in qualifications and experience.People receive different levels of education, including professional ones, and have different experience in performing certain jobs. More complex work usually requires more high level educational training. More difficult work reduces the number of applicants able to perform such work. As a consequence, in a stable society, those who are able to do more complex work, as a rule, receive more income.
3. Differences in readiness and ability to work in special conditions. The work of, for example, miners is associated with great risk, with a high degree of physical labor intensity. Work at nuclear power plants is associated with high responsibility, very complex technological systems are used here, the consequences of a violation in which can potentially cause great damage. If we take entrepreneurial activity, then it also requires the willingness and ability to take risks, work hard and hard.
4. Ownership differences.Since the beginning of the 1990s, the number of people receiving income from the ownership of capital and securities has been noticeably expanding. Among them are distinguished, first of all, those who are engaged in entrepreneurial activity. The distribution of capital, shares and other assets is one of the factors causing income differentiation.
Differentiation of incomes of the populationreally existing differences in the level of income of the population, to a large extent, predetermining social differentiation in society, the nature of its social structure. In a country with a developed market economy, the level of income is one of the most important signs that construct a social position (along with property, attitude to power, etc.)
A society with a rational income differentiation, relatively uniform, is the most stable due to the large middle class, has intensive social mobility, strong incentives for social advancement and professional growth. And vice versa, as the historical experience of Latin American countries testifies, a society with a sharp differentiation in the incomes of the extreme polar groups of the population is characterized by social instability, the absence of strong incentives for professional growth, and a significant degree of criminality in social relations.
Income differentiation is recorded by statistical agencies and "distributes" the population into groups (shares) depending on average per capita income.
Indicators reflecting the differentiation of incomes of the population are important for the analysis of various socio-economic processes, their monitoring in the course of an active social policy, and are also used in the preparation of state programs for socio-economic development.
So, the difference in income levels per capita accrual is calledincome differentiation. It is characteristic of all economic systems.
For quantification income differentiation is applied various indicators. The degree of income inequality reflects the Lorenz curve (Fig. 18.2).
Figure 18.2 - Lorenz curve
The Lorenz curve shows the ratio of the percentage of all income and the percentage of all recipients. The degree of income inequality is determined by the area between the line denoting ideal equality and the Lorenz curve.
The uneven distribution is characterized by the Lorentz curve, i.e. actual distribution lines that are further away from the straight line, the greater the income differentiation. For example, the bottom 20% of the population receive 5% of total income, the bottom 40% receive 15%, and so on.
The Lorenz curve can be used to compare the distribution of income over different time periods or between different populations.
The theoretical possibility of an equal distribution of income is represented by a straight line, which indicates that any given percentage families receive an appropriate percentage of income. This means that if 20, 40, 60% of families receive, respectively, 20, 40, 60% of the total income, then the corresponding points will be located on a straight line.
The most harmful thing for a person says Ford to assert that all people are equal. They are very different, and the one who “creates a lot” must also “bring a lot into his house”, and vice versa. This is precisely what "strict social justice, arising only through works" consists of. There is no place for charity in wages. Everyone gets exactly what they deserve.
Another thing is the level of social policy of the state. It is designed to mitigate inequality in people's incomes in order to prevent excessive social stratification and tension in society.
19.2 State socio-economic policy of incomes of the population: its role, elements, goals and methods. Comparison of socio-economic policy in the Russian Federation in the 1990s and 2000s. and its effectiveness.
The state policy of income is to redistribute them through the state budget through differentiated taxation of various groups of income recipients and social benefits. At the same time, a significant share of national income is transferred from the high-income to the low-income strata of the population. Now all the developed countries of the world have created systems of social support for the poor.
Social transfers is a system of measures of monetary or in-kind assistance to the poor, not related to their participation in the economicactivities of the national economy. Payments to the public are made from local budgets, state off-budget social funds, as well as funds of public organizations.
The mechanism of social transfers includes the withdrawal in the form of taxes of part of the income from the middle and high-income strata of the population and the payment of benefits to the most needy and disabled, as well as unemployment benefits.
Social transfers include:
All types of pensions for old age, survivors, long service, social pensions;
All types of scholarships for students of higher and secondary specialized educational institutions, professional technical schools and colleges;
All types of income received by the population on social insurance, monthly allowances for children, unemployment benefits and others;
Compensatory payments and benefits, as well as monetary charitable assistance in the form of payment for the cost or part of the cost of vouchers to a sanatorium, rest home;
Compensation for public transport costs, etc.
Social transfers in kindconsist of individual goods and services provided to the population free of charge or at reduced prices, for example, services in the field of education, culture, health care, sports, social security, housing and communal services, etc.
In recent years, trilateral commissions have been formed in our country to regulate social and labor agreements, which are called social partnership.Social partnershipthis is the cooperation of employees, employers and representatives of the state to achieve agreed decisions in the field of labor relations. The mechanism of social partnership is the negotiation process between trade unions and employers, the result of which is a collective income that affects employment, remuneration and organization of work and some aspects of the social status of the employee in the enterprise in society.
The state intervenes directly in the primary distribution of monetary income and often sets an upper limit on the increase in nominal wages. Economic importance state regulation of wages is determined by the fact that its change has an impact on aggregate demand and production costs.
The most effective means of state regulation of wages in countries with market economies is the definition of a guaranteed minimum (or rate). It is on the basis of the minimum wage that negotiations are being held between company leaders and trade unions on the conclusion of collective agreements at various levels, from enterprises to industries. These documents also stipulate various bonuses and additional payments, differentiation of wages by industry, depending on the level of qualification.
Social policy of the state, associated with the impact on the living conditions of the population, its main layers, groups, categories. It includes income policy, employment, social security, education and health policy, housing and others. Social policy is focused on the person, protection of his rights, provided for by international and national legislation.Purpose of social policymaintenance and development of a person as the highest value of any society.
Of particular importance is the problem of protecting cash income (wages, pensions, benefits) from inflation. For this purpose, it is applied indexing , i.e. increase in nominal incomes depending on the rise in prices.
In Russia, the indexation of cash income is established by law dated October 24, 1991 and applies to the wages of public sector employees, as well as to pensions, scholarships and benefits. For all other categories of people employed in production, the state regulates only the amount of the minimum wage. Indexation should be carried out when retail prices rise above 6%.
An important direction in social policy in addressing issues of protection personal income is to support the poorest segments of the population. A developed system of monetary and in-kind benefits is of decisive importance in the social protection of these segments of the population. Such a system exists in all countries with a market economy and serves as an important social shock absorber, mitigating many of the negative consequences of its development.
Poverty itself in social practice is measured using the subsistence minimum. Which is expressed in two forms: social and physiological minimum.
social minimumin addition to the minimum standards of satisfaction of physical needs, it includes the costs of minimal spiritual and social needs. It is a set of goods and services expressed in terms of value and designed to meet the needs that society recognizes as necessary to maintain an acceptable standard of living; it is assumed that the poor have more or less normal living conditions.
Physiological minimumis designed to meet only basic physical needs and pay for basic services, and for a relatively short period (without the purchase of clothes, shoes and other non-food items).
Minimum consumer budget (MPB)is the social minimum of funds necessary to ensure the normal functioning of a person. In Russia, the MPB is based on more 200 types of goods and services, including 80 types of food. Expenditures on non-food items in the BCH include expenditures on clothing, underwear, shoes, medicines, dishes, and religious goods. The MPB also includes expenses for housing and communal services, transport, taxes and fees.
The structure of the minimum consumer budget:
- food 46.1%;
- non-grocery goods 39%;
- services 13.2%;
- taxes and fees - 2.7%.
The social policy of the state is aimed at solving the following tasks:
- stabilization of living standards of the population and prevention of mass poverty;
- curbing the growth of unemployment and material support for the unemployed;
- maintaining a stable level of real incomes of the population;
- development of sectors of the social sphere (education, healthcare, housing, Culture and art).
Social policy is aimed at weakening the differentiation of income and property, mitigating contradictions between market economy participants and preventing social conflicts on economic grounds. Therefore, an important task of social policy is targeted (that is, intended for specific groups of the population) social support from the state, primarily the weakly protected layers. This task involves maintaining optimal ratios between the incomes of the active (employed) part of the population and disabled citizens through the mechanism of taxes and social transfers.
Additional questions for the seminar session on topic 19:
1. Peculiarities of population differentiation by income about ladies in Russia (2000s).
2. Essence and methodology for calculating indicators characterizing differentiation coe f Gini factor and decile coefficient.
3. Main directions of social policy.
4. Features of the social policy of the state in Russia in the 90s. and 2000s. similarities and s lichia.
5. The essence of the concepts provided for in the legislation of the Russian Federation: living wage, consumer and body basket, minimum wage.
Other related works that may interest you.vshm> |
|||
| 19673. | Income policy and social protection of the population | 353KB | |
| The problems of equitable distribution of income faced mankind at all times. Conflicts and wars broke out on the basis of the division of profits, but we live in a civilized society and the issues of income differentiation are more than important for all of us. | |||
| 854. | The income of the population. Level and quality of life | 61.73KB | |
| In connection with this goal, the main tasks of the work are set - to define the concepts of standard of living and quality of life, to describe measurement indicators, to reveal the importance of studying these concepts, to determine on the basis of analysis state of the art level and quality and quality of life of the population of Russia. | |||
| 5865. | Social work and social policy: interconnection and mutual influence | 9.42KB | |
| The essence of social policy is its principles and functions. Interrelation of social policy and social work. The essence of social policy is its principles and functions. Among the factors contributing to the harmonization of the interests of the individual and society, guaranteeing the protection of the interests of a person, his rights and freedoms, a special place belongs to the social policy of the state and the entire infrastructure of social work with various groups of the population. | |||
| 1227. | Social policy of the organization | 2.29MB | |
| The study of the cost of working time of employees in the organization. Studying the cost of working time of employees in the organization Analyze your working day and make recommendations to reduce the loss of working time. Timing of the working day Operation number. | |||
| 21565. | Social policy of the organization during the economic crisis | 17.8KB | |
| Some believe that the social policy of an enterprise is a local regulatory act of a company that defines the concept of strategy and principles of decision-making in the processes of non-material and material motivation of the company's personnel. The social policy of the organization should solve a number of tasks: Increasing the attractiveness of the company in the labor market attracting qualified specialists. The following types should be distinguished social programs companies: Material social programs social programs as a result of which the employee receives ... | |||
| 20591. | Social policy and social work in non-governmental public organizations | 495.52KB | |
| The problems of refugees in Russia are dealt with by the Federal Migration Service and its subordinate agencies. The main areas of work of the federal body of the migration service and the territorial bodies of the migration service with refugees and internally displaced persons include the reception of refugees, granting them status forced migrant or a refugee, keeping records, assisting them in settling in and providing them with comprehensive support within the limits of their authority. The problem of refugees is international in nature and the relevance of this... | |||
| 20679. | State financial policy | 30.49KB | |
| Economic content and goals of the state's financial policy. The essence of the purpose and objectives of the financial policy of the state. Organization of the financial policy of the state. Types of financial policy of the state. | |||
| 16481. | Antimonopoly policy of the state | 10.33KB | |
| Basically, researchers dwell on the issues of antitrust policy in the United States, which has been developed since 1890, and in Russia, the first unsuccessful attempts to create such legislation were made only before the First World War. Modern literature on the problem of Russian antimonopoly legislation is not so diverse. The purpose of this work to conduct a study on the emergence of the formation and development of antimonopoly legislation. Tasks: to study the stages of the formation and development of... | |||
| 16818. | Social policy of the company as a tool for managing social factors to increase corporate sustainability | 9.86KB | |
| At the same time, studies of the factors of increasing corporate sustainability are of particular practical importance. Corporate sustainability, in our opinion, can be defined as the ability of a company to provide sustainable financial results, effectively manage risks, adapt to the constantly changing external business environment, introduce innovations, form long-term sustainable competitive advantages.... | |||
| 18691. | Modern financial policy of the state | 31.56KB | |
| To reveal the content and essence of the financial policy of the state; Consider the types of financial policy; To study the role of the state in the life of society; Consider the financial policy of the state in Russia. | |||
The more difficult the economic situation in a particular country, the more and louder the calls for social protection of the population sound in it. Such protection is strongly requested and demanded from the government. The complexity of the situation lies in the fact that if there is an economic recession in the country, production is decreasing, the created national product is decreasing, then the possibilities of the government, state, and regions to allocate additional funds for social protection of the population are extremely limited. The burden on the state budget is increasing, the government is forced to resort to increasing taxes, and as a result, the incomes of enterprises and workers are declining. And this creates new social tensions.
To rectify this situation, the desire of people to receive social protection from the hardships of a deteriorating life is not enough, just as the intentions and promises of the government to improve life are not enough. The problem can be completely solved only when the economy goes up and begins to create the minimum of goods that people need. This is ultimately what salvation is.
First of all, it should be understood that if the production of goods and services in the country has decreased, and assistance from abroad is small and import purchases are not able to compensate for such a decrease, if, in addition, stocks and reserves are reduced to a minimum, then prevent a decrease in the standard of living, consumption almost impossible.
Therefore, both the government and the people must realize that the total social protection of the population from a decline in living standards in the absence of an economic upswing is impossible. It is more correct, more justified, to speak of social support individual strata and groups of the population most in need of it. Such categories of the population are usually called socially vulnerable groups. To socially vulnerable include, first of all, persons deprived of the opportunity to improve their well-being by their own efforts, to maintain the minimum necessary conditions of life and existence.
In the broad sense of the word, people with incomes below the subsistence level are considered socially vulnerable. Strictly speaking, when classifying certain groups of people as socially vulnerable, one should take into account not only their current income, but also monetary savings, accumulated wealth, the so-called property qualification. However, since it is difficult to obtain reliable information about the property status of people, it is necessary to use as a criterion characterizing the financial situation of a person, his official cash income.
In current practice, families with a low monetary income per family member (most often large families), families that have lost their breadwinner, mothers raising children alone, the disabled, the elderly, pensioners receiving insufficient benefits, students living on scholarships, the unemployed, people affected by natural disasters, political and social conflicts, illegal persecution. In some cases, children are classified as socially vulnerable groups. All these people need social support from society, authorities, government.
Social support can be manifested in a variety of forms: in the form of financial assistance, the provision of material benefits, free food, shelter, shelter, medical, legal, psychological assistance, patronage, guardianship, adoption.
The question of whom, in what types and forms, to what extent to provide social support, is one of the most difficult in the social economy. Since it is simply impossible to help everyone who wants help and those who need it, a number of economists and sociologists give the following recipe: "help only those who are not able to help themselves."
During the transition to market economy the problem of social protection of the population from rising prices (inflation) and unemployment is most acute. In order to ensure that rising prices for goods and services do not lead to a catastrophic decline in consumption and living standards, it is partially applied income indexation. This means that salaries, pensions, scholarships, and other types of income increase as retail prices rise.
Unfortunately, with a sluggishly growing, declining economy and a low level of production, neither the government nor enterprises have the opportunity to raise incomes, wages, and pensions to a degree sufficient to keep up with prices. If the number of goods created, produced, bought abroad does not increase, then the payment of an excessive amount of money will lead to the flooding of the market with money supply and, as a result, to an increase in prices, which will require an increase in income, etc. will arise inflation spiral . Therefore, it is necessary to raise incomes to a somewhat lesser extent than rising prices.
Population income is the total amount of cash and in-kind funds received or produced by households in a given period. Types of income are divided into monetary, natural, disposable and real.
Monetary income of the population include the income of entrepreneurs and the so-called self-employed (farmers, lawyers, etc.), salaries of employees, pensions, allowances, scholarships and other social transfers, income from property in the form of interest on deposits, securities, dividends and other income.
Natural income of the population- all receipts of agricultural products: agricultural products, animal husbandry, various products, services and other products in kind, obtained from household plots, garden plots, households, self-procurement of gifts of nature intended for personal, family consumption.
Under household disposable income refers to the income of the population minus taxes. It is disposable income that is the source for final consumption of goods and services and savings.
Of these incomes, their main part is distinguished - real disposable money income, which are determined based on the cash income of the current period minus mandatory payments and contributions adjusted for the consumer price index.
To date, all developed countries of the world have created systems of social support for the poor.
Social transfers- this is a system of cash or in-kind payments to the population, not related to its participation in economic activities at the present time or in the past. The purpose of social transfers is to humanize relations in society, prevent the growth of crime, and also maintain domestic demand. Examples of social transfers are pensions (for example, for disability or in connection with the loss of a breadwinner), scholarships, allowances (for children, for burial, etc.).
The state, organizing the redistribution of income through the budget, solves the problem of increasing the incomes of the poor, creates conditions for the normal reproduction of the labor force, helps to ease social tension, etc. The degree of state influence on the process of income redistribution can be measured by the volume and dynamics of spending on social goals at the expense of the central and local budgets, as well as the amount of income taxation. In developed countries, 40-50% of the expenditure part of the budget is allocated for social purposes, in Russia only 15%.
The state intervenes directly in the primary distribution of cash income and sets the minimum wage. Less often - the upper limit of the increase in nominal wages. The economic significance of state regulation of wages is determined by the fact that its change has an impact on aggregate demand and production costs. The income policy is used by the state to regulate wages in order to reduce production costs, increase the competitiveness of national products, encourage investment, and curb inflation. State, conducting anti-inflationary policy may temporarily centrally set a long-term limit on wage growth, taking into account the general needs of economic and social development.
Methods for implementing income policy in a market economy and a transition economy may be different. Preference is usually given to methods of voluntary consent of employers and employees with the participation of the government, which does not exclude the use of administrative measures, state control over linking wage increases with financial possibilities enterprises. In a number of Western European countries, there are so-called permissible limits for its increase, fixed in national programs of social partnership.
Of particular importance is the problem of protecting cash income (wages, pensions, benefits) from inflation. For this purpose, indexing is applied, i.e. a mechanism established by the state to increase the monetary income of the population, which allows it to partially or fully compensate for the rise in the cost of consumer goods and services.
In Russia, the indexation of cash income is established by the law of October 24, 1991 and applies to the wages of public sector employees, as well as pensions, scholarships and benefits.
An important direction in social policy in addressing issues of personal income protection is the support of the poor.
Poverty- this is the economic state of a part of society in which there are no minimum, according to the norms of this society, means of subsistence. The state of poverty is characterized by a rather long absence of resources that cannot be compensated either by previous savings or temporary savings on the purchase of expensive goods and services. A developed system of monetary and in-kind benefits is of decisive importance in the social protection of these segments of the population. Such a system exists in all countries with a market economy and serves as an important social shock absorber, mitigating many of the negative consequences of its development.
To classify certain categories of the population as eligible for social assistance, indicators are used that determine the level (threshold) of poverty.
Absolute poverty line- this is the minimum standard of living, determined on the basis of the physiological needs of a person in food, clothing and housing, i.e. on the basis of a set ("basket") of goods and services sufficient to meet basic human needs. In Russia, the absolute poverty line coincides with the subsistence minimum.
Cost of living (PM) is a natural set of food products that provide the minimum required number of calories, as well as the cost of non-food products and services, taxes and mandatory payments, corresponding in terms of the cost structure for these purposes to the budgets of low-income families. In Russia, the food packages used in the calculation of the subsistence minimum are differentiated by various socio-demographic groups (men and women of working age, pensioners, children under and over 6 years old)
Relative poverty line shows how much the minimum consumer basket (poverty line) costs relative to the average level of prosperity in a given country (region). Thus, in Russia, the relative poverty line is an income level that is less than 35% of the average income in the region; in the EU member countries, it is below 70% of the average total household expenditures in the country.
The criterion of absolute poverty in the EU countries is the average per capita income for each family member below 7 euros per day.
The social policy of the state, in Russia today, is aimed at solving the following problems:
1) stabilization of the living standards of the population and prevention of mass poverty;
2) curbing the growth of unemployment and material support for the unemployed, as well as preparing labor resources of such a size and quality that correspond to the needs of social production;
3) maintaining a stable level of real incomes of the population through anti-inflationary measures and indexation of incomes;
4) maintenance in a normal state and development of sectors of the social sphere (education, health care, housing, culture and art).
Introduction.
1. Incomes of the population and social policy of the state.
1.1. The income of the population.
1.1.1. The concept of income of the population.
1.1.2. Types of income and sources of their formation.
1.1.3. Wage as the main form of income of the population.
1.2. income differentiation.
1.2.1. Factors that form incomes and causes of social inequality in their distribution.
1.2.2. Assessment of income differentiation.
1.2.3. Methods for calculating the coefficient of differentiation.
1.2.4. The problem of income equalization. Consequences of their inequality.
1.3. System of indicators of living standards and poverty.
1.3.1. Standard of living.
1.3.1.1. Indicators of the standard of living.
1.3.2. Poverty level.
1.3.3. The cost of living. Living wage.
1.3.4. The quality of life.
1.4. State redistribution of income. Social protection of the population.
1.4.1. State regulation of income distribution.
1.4.2. Social protection systems.
2.
2.1. Principles of formation of social indicators of the Russian economy.
2.2. The level and quality of life of the population of modern Russia.
2.2.1. Indicators of the standard of living.
2.2.2. Living wage.
2.2.3. Purchasing power population.
2.3. Social indicators of the Russian economy in the period of reforms.
2.3.1. Population income indicators.
2.3.2. Income differentiation and the problem of poverty.
2.4. Social indicators are benchmarks for Russia's economic development.
Conclusion.
List of used sources.
Applications.
Introduction
Income plays a very important role in the life of every person. Cash income, for example, ensures the satisfaction of his many needs. The majority of the population receives income in the form of wages, scholarships, pensions, etc.
This topic is of particular interest to us, Russians, because only 15 years ago we had to radically change our attitude towards the issue of income distribution, because. the initiated reforms of the transition to a market economy led to their sharp decline and further to a severe stratification of society into the poor and the rich with a small number of "middle class". The state faced the problem of finding ways of economic stability, overcoming the negative consequences of the reform, and then setting goals for the development of the social sphere, increasing the income of the population and improving the level and quality of life of citizens.
The relevance of this topic is determined by the need to study the theoretical aspects of the formation of incomes of the population in order to identify the causes of their differentiation and, as a consequence, social inequality.
The topic is very relevant for our country, because. The reform changes taking place in Russia are associated with certain difficulties in the formation of market relations and necessitate consideration and improvement of the income distribution model between different strata of society.
For our state, the issues of active participation in the regulation and redistribution of income are caused by the lack of formation and insufficient size of the "middle class", which is a prerequisite for the development of a socially oriented economy.
The tasks set during the disclosure of the topic are as follows:
1. To study the theoretical aspects of income generation, the role of the state in their regulation.
2. To study the main directions of the social policy of Russia's economic development in the field of income redistribution and improving the welfare of citizens.
3. Consider the social indicators of the Russian economy during the reform period and further prospects for the development of the country associated with an increase in the level and quality of life of the population.
theoretical and methodological framework works were published scientific works of domestic authors on the formation and distribution of incomes of the population, methods of their state regulation. For a deeper study of the socio-economic policy of modern Russia, materials from the periodicals "The Economist", "Eco", "Economy and Life", "Russian Economic Journal", " Russian newspaper", as well as Internet resources.
The paper uses tables and diagrams to analyze the content of the issues under consideration and visualize them.
1. Incomes of the population and social policy of the state
1.1 Income of the population
1.1.1 The concept of income of the population
The size and composition of income is one of the most important, albeit incomplete, characteristics of the standard of living of the population. The income of the population not only determines its financial situation, but also largely reflects the state and efficiency of the economy and economic relations in society. Incomes are characterized by the level, composition and structure, dynamics, correlation with expenditures, differentiation by different strata and groups of the population.
Under the income of the population is understood as the totality of receipts in cash and in kind received by a person, family, household from various sources over a certain period of time (month, year), spent on consumption, accumulation, payment of taxes, collections and payments.
In accordance with modern concepts, the standard of living of the population and its income are determined not only and not so much for the whole society or the “average citizen”, but for households representing the entire population. Indeed, only at the level of a household belonging to one or another socio-demographic type, having one or another gender and age composition of members and the ratio of employees and dependents, its average per capita income can reasonably and correctly judge the standard of living of the population, naturally generalizing data on individual households.
If we talk about society as a whole, then its income should be considered as the gross domestic product or the sum of the incomes of all economic entities, which also represents the value and the part of the product it measures, produced in a certain period of time. The income of an individual, a household, a social group is a part and the corresponding value of the product produced, which is obtained as a result of their economic activity. The distribution of consumer goods and commodities, as a rule, is preceded by the distribution of income. Thus, the population receives its share of the gross product, which goes to meet personal needs, initially in the form of income. The income received is used further to purchase the necessary goods and services.
The interpretation of the very concept of "income" by some modern economists is carried out in a more detailed form, while others take into account only some aspects. I. P. Nikolaeva points out that income is “a part of the produced product received by a participant in production, depending on his participation in it.” According to A.S. Bulatov, income is “the amount of money and material goods received or produced by households over a certain period of time”.
The indicator of the monetary income of the population - serves to measure income at the macro level and is calculated according to the balance of cash income and expenditures of the population.
When studying income, it is advisable to single out separate stages of the reproduction process, such as education, primary distribution, distribution, the formation of final (disposable) income, the use of disposable income for final consumption and savings.
“These stages can be studied at the household level, and the characteristics of the volume and structure of income at each stage will characterize various aspects of the economic behavior of households: income generation (the flow of all resources into the household), the formation of final income (tax and other payments), the use of final income for consumption and accumulation.
On the stage formation and distribution of primary income– household income is primarily wages of employees, mixed income of households from their own production activities and income from property. All these incomes are paid to households from the value added created in the production process.
At the stage secondary distribution of income households' primary income is converted into disposable income through transfers and taxes.
Stage income redistribution involves the interaction of households, public institutions and non-profit organizations serving the public. At this stage, income is redistributed in favor of households through the transfer of social transfers in kind from government agencies and non-profit organizations. The final characteristic of the use of the disposable income received and adjusted in this way is the actual consumption of households, calculated as the sum of their final consumption expenditures and social transfers in kind. Disposable adjusted income is also allocated to final consumption and savings.
AT Soviet period incomes of the population were completely determined salary, pensions and benefits paid government organizations and departments. With the transition to the market, the number of different types of incomes of the population increased significantly, and their incomes began to be determined to a greater extent by labor and economic activity, initiative people, i.e. ultimately, their adaptation to new economic conditions.
1.1.2 Types of income and sources of their formation
In order to more fully study the incomes of the population, we will consider their types and classifications.
According to the main types of employment, the labor income of the population can be classified as follows:
− income from employment at the place of the main job;
− income from secondary employment;
− Income from self-employment.
Depending on the accounting for the dynamics of the level of consumer prices, income is divided into:
- nominal - this is the amount of money received in a certain period by an individual; it also characterizes the level of cash income regardless of taxation;
- real - represents the amount of goods and services that can be bought with disposable income during a certain period;
− disposable income - income that can be used for personal consumption and personal savings. Disposable income is less than nominal income by the amount of taxes and obligatory payments.
According to the form of the unit of income, there are:
− monetary;
− natural .
Monetary incomes of the population include wages for work of all categories of the population, pensions, allowances, scholarships and other social transfers, income from property in the form of interest on deposits, securities, dividends, income from persons engaged in entrepreneurial activities, as well as loans, income from sales foreign exchange and other income. Monetary income, net of taxes, obligatory payments and contributions, is the disposable monetary income of the population.
Salary . This item of monetary income of the population includes amounts of remuneration in cash and in kind for hours worked and unworked, incentive payments and allowances, compensation payments related to the mode of work and working conditions, bonuses and one-time incentive payments, as well as payments for food, housing, fuel, which are of a regular nature.
Income of workers and employees from enterprises and organizations also includes social payments and other payments.
Social payments include, in particular, insurance payments (contributions) paid by enterprises under contracts of personal, property and other insurance in favor of their employees, at the expense of the enterprise; severance pay upon termination of the employment contract, amounts paid to laid-off employees for the period of employment in connection with the liquidation of the enterprise, reduction in the number or staff of employees; payment for travel to the place of work by public transport, special routes, departmental transport; material assistance provided to individual employees for family reasons for burial, etc. At the same time, supplements to pensions for employees working at the enterprise, paid at the expense of the enterprise's funds, are excluded.
Other payments not related to the payroll and social benefits , include travel expenses, royalties, wage supplements paid to employees of certain sectors of the economy due to the mobile (travelling) nature of work, field allowances, the cost of uniforms issued free of charge, uniforms remaining in personal permanent use, or the amount of benefits in connection with their sale at reduced prices, etc.
Dividends . This item includes income from shares, interest, payments on equity shares from the participation of employees in the ownership of an enterprise, institution, organization and is determined according to the balance sheet of the enterprise.
Proceeds from the sale of agricultural products . This article includes the receipt of proceeds from the sale of livestock and other agricultural products to procurement organizations, consumer cooperatives, collective farms and state farms, various organizations in the markets, etc.
Pensions and benefits . This article includes all types of pensions and benefits received by the population from the federal and local budgets, the budget of the Pension Fund, the Fund social insurance Russian Federation, State Fund employment, the Federal Migration Service, trade unions, enterprises.
Scholarships . This article includes all types of scholarships for students of higher and secondary vocational schools, technical schools, courses, retraining institutes, and graduate students.
Proceeds from financial system . Receipts from the financial system include: a) insurance claims; b) loans for individual housing construction and other purposes; c) change in debt on loans issued for consumer purposes; d) interest on deposits; e) winnings and repayments on loans; f) lottery winnings; g) change in the debt of the population for the purchase of goods and credit; h) change in debt on loans to persons carrying out activities.
Depending on government intervention, revenues are allocated:
- primary, formed under the influence of the market mechanism;
- secondary, the formation of which is associated with the redistributive policy of the state.
Unrecorded income, i.e. income from the informal sector of the economy.
The informal sector of the economy is considered by the International Labor Organization as a set of very small economic units that produce and distribute goods and services. They consist mainly of independent, self-employed producers.
The most typical types of informal activities are: street trading; services to the population in construction, repair, tailoring; private services - cleaning, cooking; tutoring, private lessons; as well as brokerage and intermediary activities.
For most people, income from informal employment is secondary. First of all, this applies to those who work part-time or are on administrative leave; those employed in low-wage industries. Young people and students in general are most involved in the informal sector. Older people with additional income, especially pensioners, usually receive it from informal employment. People with a high level of education are less likely than others to have additional income in the informal sector.
Let us dwell in more detail on the main form of income - wages.
1.1.3 Salary but as the main source of income of the population
The wage, or wage rate, is the price paid for the use of labor.
It is necessary to distinguish between monetary, or nominal, and real wages. Nominal wage is the amount of money received by an employee for a certain period of time (hour, day, week, etc.). The disposable salary is the amount of wages minus income tax and mandatory contributions to the Pension Fund. Real wages are the amount of goods and services that can be purchased with nominal wages; real wages is the purchasing power of nominal wages.
Wages perform several functions, the most important of which are reproductive, stimulating, status, regulatory, production-sharing.
The reproductive function consists in determining such an absolute amount of wages that allows normal reproduction of the labor force without resorting to additional work, since additional work leads to the depletion of labor potential, a decrease in professionalism, and a deterioration in labor and production discipline.
The status function of wages implies that the status determined by the amount of wages corresponds to the labor status of the employee. Employment status is the position of an employee in relation to other employees. Therefore, the amount of remuneration for work is one of the main indicators of this status, and its correspondence with the labor efforts of the employee makes it possible to judge the fairness of the size of his wages.
The stimulating function of wages involves the motivation of the employee to labor activity, to maximize returns, and increase labor efficiency. This goal is to establish the amount of remuneration for work, depending on the results achieved by the employee.
The regulatory function of wages affects the ratio of labor supply and demand, the formation of personnel and the degree of its employment. This function acts as a balance between employees and the employer. The basis for the implementation of the function is the differentiation in wages by groups of workers.
The production-share function of wages determines the degree of participation of living labor in the formation of the price of goods, its share in total production costs and labor costs. This share allows you to set the value of the labor force, its competitiveness in the labor market.
The minimum wage is a social norm, it represents the lowest limit of the labor cost of the simplest labor under normal conditions of production. It is established by state laws. The main criteria for the minimum wage are:
- the needs of the employee and his family, taking into account the general level of wages in the country, social benefits;
− factors of an economic nature (the level and growth rate of national income, the level of employment, the country's solvent balance).
The introduction of the minimum wage served several purposes. The first is to eliminate the over-exploitation of low-skilled workers. The second is to raise the lowest levels of wages in order to raise the overall level of wages. And the third is support for social policy in the field of redistribution of national income.
At its core, the minimum wage is the provision of the amount of subsistence necessary for the simple physical reproduction of the labor force. In this case, wages provide only a reproductive function.
According to the conclusion International Commission, created at the initiative of the EU in 1989, a minimum wage is considered fair, which reaches 68% of the national average wage. In developed countries, this principle is observed, and in some even the recommended standard is exceeded. Thus, the stimulating function of wages is realized.
An increase in the minimum wage can be achieved by gradually bringing its value closer to the subsistence level or by lowering the consumption standard. If the level of the minimum wage is raised without increasing demand in the labor market, this will lead to a decrease in the number of employees, to mass layoffs, and to a sharp increase in unemployment. Another way is the development of production, investment, structural restructuring of the economy. This will increase employment and, consequently, income.
Under the differentiation of income is understood the difference in the level of monetary income of different strata and groups of the population.
Incomes of the population change under the influence of many factors: socio-political, socio-demographic, socio-professional, socio-status, socio-economic, socio-geographic. As can be seen, all factors are related to social orientation: the political regime determines the direction of social programs, income and wage policies within the framework of economic policy.
In general, the factors that form the income of the population can be of three levels:
- the first level includes factors that depend on the person himself, his life position, his human capital and labor potential (education, qualifications, experience, type of employment, official status, costs and results of labor, the presence of professional and position (career) growth, the availability of capital in any of its manifestations (educational, professional, financial, etc.));
- the second level (micro level) includes factors related to the place of work where a person is employed; with the industry, which includes his enterprise, institution, organization, firm; with the form of ownership of the enterprise, its organizational and legal form; position of the company on the commodity, financial markets and the labor market; with the technical equipment of the enterprise, with its location; the development of social and labor relations in the team;
- the third level (macro level) includes factors related to the country's economy as a whole and the regional economy: economic potential, efficiency of social production, gross national product and national income, pricing policy and taxation system, development of social partnership institutions in the regulation of labor relations. This group of factors forms the system of social transfers.
Thus, the considered factors indicate the dependence of income on the attitude of the employee to work and on his merits, on the individual and collective results of labor and the efficiency of the economy as a whole, and also on the fact that there is differentiation, stratification of the population by income level, including labor.
The boundaries between these groups of factors may be more or less flexible: innate abilities and talent may not lead to income growth and find no application, while modest abilities may be developed as a result of education and strong work motivation; possession of property by inheritance can lead both to its increase and to the loss of objects of property from it.
The differentiation of the monetary incomes of the working population is formed mainly under the influence of two factors: the differentiation of wages and the differentiation of differences in the marital status of workers. However, the differentiation of wages and incomes cannot be assessed from the same positions. In the first case, there is economic inequality that corresponds to the concept of social justice within the framework of this social order. In the second, the inequality that develops as a result of the redistribution of income in families can be called to a certain extent “unfair” in that part that is caused by circumstances that are not related to the work and merits of people.
Although economic inequality and the differentiation of society are determined not only by the uneven distribution of income, but also by unequal property status and differences in consumption, in determining the degree of such inequality, as a rule, proceed from income differentiation. In conditions centralized economy and an egalitarian society based on an equal distribution of incomes of the population, the problems of differentiation and economic inequality are insignificant. The situation changes with the transition to market relations. A high level of income differentiation is inherent in countries with market economies, especially at the initial stage of development, and is associated with employment restrictions, inflation, and shifts in the structure of production.
Countries with efficient economy and high levels of national wealth have more resources and opportunities to fight socio-economic inequalities. It is much more difficult to solve these problems in poor countries.
Consider the causes of inequality in the distribution of income. First of all, we are talking about the presence or absence of conditions for generating income. Therefore, the growth of unemployment objectively strengthens this inequality, which is supplemented by a number of moral and psychological factors that worsen the social situation of people who do not find an adequate application of their abilities in the economic life of society.
The reasons for inequality in the distribution of income also include the level of education and training. These factors predetermine the employee's ability to perform certain professional functions or types of work, which is objectively related to the level of payment for the services provided by him. In addition, a higher level of education and training creates the prerequisites for high labor force mobility in the face of inevitable accelerated structural changes in social production, which again reduces society's costs for the preparation and implementation of certain new types of economic activity.
The next cause of social inequality is the relationship of property ownership, which is associated with unearned income. These are interest, dividends, rent. Considering that property is inherited, it can be concluded that the property differentiation of the population is accompanied by its differentiation in terms of income. Of course, property relations often interact with other revenue factors. However, for the vast majority of the population, property incomes act as an addition to the main income, and an insignificant part of the population gets the opportunity to appropriate high incomes for property, which is their fundamental and sometimes only source.
1.2.2 Assessing income differentiation
In order to reveal the differentiation, the aggregates of households are examined by the level of their average income per household or average per capita income.
The income differentiation of the population can best be demonstrated by its distribution according to the level of average per capita cash income and represents indicators of the number (or shares) of the resident population, grouped in given intervals of these incomes.
Differentiation is assessed not only by the level of income in general, but also by the size of households and their socio-demographic types, employment, the ratio of the number of employed and dependents, the number of children, and the sex and age characteristics of its members. But the main differentiating features remain the level of remuneration and other primary incomes and the degree of "dependant load". ».
One of the serious factors in the growth of differentiation is inflation, in which payments are practically not indexed as prices rise, and the consumer basket rises in price at a rate that outpaces the overall rise in prices.
The distribution of the total amount of money income among different groups of the population is expressed in terms of percentages of the total amount of money income that each of the 20-(10) percent groups of the population has, distributed as per capita money income increases.
The degree of social stratification is characterized by funds ratio(Income Differentiation Coefficient), which is defined as the ratio between the average levels of monetary income of the top 10% of the population and the bottom 10% of the population.
The indicator of average income is very sensitive to an increase or decrease in the proportion of high-income or low-income groups of the population. In the statistics of most developed countries, to characterize the overall level of income, not the average, but the median level is given, that is, the level above and below which the same number of workers receive income. Another characteristic used in the study of income is the fashion, which is the most common level of income.
Another interesting technique for analyzing the incomes of the population from the point of view of their differentiation is the calculation of the so-called accumulated, or cumulative, frequencies (shares) and the construction of cumulative curves, or Lorenz curves. The theoretical aspects of these measurements will be considered below.
1.2.3 Methods for calculating the coefficient of differentiation
One of the most well-known ways to measure income inequality is the construction of the Lorenz curve, named after the American economist and statistician Max Lorenz. We are talking about a personal, not a functional distribution of income.
Calculations of differentiation indicators are based on the construction of the Lorenz curve , which is the cumulative distribution of the population and the corresponding incomes. As a result, it shows the ratio of the percentage of all income and the percentage of all their recipients.
If incomes were distributed evenly, i.e. one 0% recipients would have a tenth of the income, 50% half, etc., then such a distribution would look like a line of uniform distribution (diagonals of a square with sides or 0% up to 100%). Uneven distribution is characterized by the Lorenz curve (the line of actual distribution), which is further away from the straight line, the greater the differentiation.
Numerically estimate the degree of inequality d allows the Lorentz concentration coefficient K L, or index jini, after the Italian economist and statistician Corrado Gini (1884-1965). For a uniform distribution, it is equal to zero, in conditions of absolute inequality - to one.
In reality, the actual distribution of income is shown by the line oabcde . The more this line, or Lorenz curve, deviates from the line oe, the greater the inequality in income distribution. If we divide the shaded area by the area of the triangle ofe , we get an indicator that reflects the degree of inequality in the distribution of income.
If the area of the unshaded section of the graph is denoted by the letter T, then the following ratio can be obtained:
where G is an indicator that measures the degree of income inequality.
Obviously, the greater the deviation of the Lorentz curve from the bisector, the greater the area of the figure T, and, consequently, the more the Gini coefficient will approach 1 and the higher the income differentiation will be. Conversely, the closer its value is to zero, the more even is the distribution of income. It should be noted that this coefficient cannot be equal to either one or zero, since a civilized market economy excludes such extremes due to the purposeful redistribution of income.
To calculate the Lorentz concentration coefficient (Gini index), the following formula is used:
K L= S 0 / S abc = 1 − ![]() ,
,
where (F i - F (i -1)) is the proportion of the population related to the i-interval;
S i , S (i -1) - the share of total income attributable to the beginning and end of the i-interval.
The coefficient of funds (K j) measures the ratio between the average incomes within the compared groups:
K j \u003d S 10 / S i,
where S 10 is the total income that falls on 10% of the population with the highest incomes,
S i is the total income of the 10% of the population with the lowest incomes.
1.2.4 The problem of income equalization. Consequences of their inequality
Changes in the incomes of the population and the stratification of society lead to the most negative consequences. Layers of people are being created who are below the poverty line, which is unacceptable in a developed society. There is a moral stratification of society into "us" and "them", the commonality of goals, interests, a sense of healthy patriotism is lost. As a result of a low standard of living, the labor activity of the population decreases, health deteriorates, and the birth rate decreases, which leads to demographic crises.
Inequality in income and wealth can reach enormous proportions and then it creates a threat to the political and economic stability in the country. Therefore, almost all developed countries of the world are constantly implementing measures to reduce such inequalities.
There are two approaches to the problem of income equalization. Supporters of the first believe that when full equality of incomes is achieved, society achieves the maximum satisfaction of consumer needs.
Supporters of the second point of view believe that income inequality is necessary to maintain incentives for increasing the efficiency of production.
As the estimates of some Western economists show, attempts to increase the incomes of the poor by withdrawing certain amounts from the rich turn into serious losses in efficiency.
All human features (strong and weak, dexterous and clumsy, talented and ordinary, industrious and lazy, educated and ignorant), forming the unique individual image of each, determine the different possibilities of people in the competition for their personal happiness and well-being.
From the point of view of economists, this inequality of opportunity is manifested in the consumer market in the unequal purchasing power of buyers, which is based on the inequality of their incomes.
However, absolute equality in income is undesirable. The fact is that such an organization of economic life kills people's incentives for productive work. People have different abilities, so the demand for rare abilities far exceeds the supply. And this leads to an increase in the income of such people. However, people with the same type of abilities perform the same duties also in different ways, with different labor productivity and product quality. Therefore, people have to pay for the activities in different ways.
Because of this, a certain income inequality should be recognized as normal. Moreover, it is an extremely important tool for encouraging the labor activity of people.
1.3 System of indicators of living standards and poverty
1.3.1 Standard of living
To assess well-being, such an indicator as the standard of living is important. It characterizes the degree of satisfaction of the physical, spiritual and social needs of the population. The standard of living is determined, on the one hand, by the quantity and quality of life's goods and services used to meet the needs of the population, and on the other hand, by the degree of development of people's needs. The stage of development of the production of consumer goods affects the standard of living. It depends not only on current production, but also on the size of the national wealth, as well as on the accumulated property of the population.
The modern economic dictionary interprets this concept as follows: "The standard of living is the level of well-being of the population, the consumption of goods and services, a set of conditions and indicators that characterize the measure of satisfaction of the basic vital needs of people."
Experts understand the term “standard of living” differently and use different interpretations of it. Indeed, the concept of the standard of living is very complex, multifaceted and requires clarification, both in its most general sense, and in its individual interpretations used in various applications.
The standard of living exists and is used together with a whole family of synonymous terms: the welfare of the people, the quality of life, the degree of satisfaction of the material and spiritual needs of the working people, the situation of the population.
First of all, it is the people's welfare, the broadest and most capacious concept from this set. People's well-being was also understood as a complex socio-economic phenomenon that combines the characteristics of the level, image and quality of life of the population. Ultimately, people's well-being reflects the development of people's needs, the state and methods of their satisfaction in relation to the main spheres of life, labor, consumption, culture, reproductive behavior, and socio-political life.
As for the term “quality of life”, recently it has been understood in two interpretations: a broader one and a relatively narrow one. In a broad interpretation, the satisfaction of the population with their lives is understood in terms of various needs and interests. This concept covers: characteristics and indicators of the standard of living as economic category, conditions of work and rest, housing conditions, social security and guarantees, law enforcement and observance of individual rights, natural and climatic conditions, indicators of environmental conservation, the availability of free time and the ability to use it well, and finally, subjective, feelings of peace, comfort and stability .
In a narrow sense, it covers the listed characteristics without the actual standard of living in its economic sense (income, cost of living, consumption).
The standard of living of the population is determined not only by the labor efforts and economic activity of individuals, families, labor collectives, but also by the efficiency of the economy and the level of national wealth in general, the ways in which the social product is distributed, and the socio-demographic structure of the population.
Naturally, countries with an efficient economy and significant social wealth are able to provide their citizens with higher living standards and social guarantees than economically backward countries. The same can be said about countries with a predominantly working-age population and a high level of employment.
1.3.1.1 Living standards indicators
In today's conditions, attention has increased to assessing the standard of living. The accents in the use of the system of indicators of the standard of living have also changed. They have somewhat shifted from the measuring-evaluative and the side of its evaluative-comparative function. A very important direction is the use of indicators of the standard of living and for carrying out on an objective settlement basis comparisons. In terms of time to assess the impact of ongoing socio-economic transformations on the life of the population, for individual income and property groups of the population - to determine the degree of economic differentiation of society, as well as for various regions of the country to assess and take into account discrepancies in the level and conditions of life of the population in them..
In order to represent the standard of living, it is necessary to have a certain standard against which the actual data can be compared. The “consumer basket”, which includes a set of goods and services corresponding to a certain level of consumption, acts as such a standard. At the same time, it is necessary to distinguish between the minimum and rational consumer baskets.
Minimum consumer basket calculated for a standard family of four, of which two are school-age children. It represents the minimum allowable consumer set, the reduction of which becomes socially unacceptable. Hence the concept of the subsistence minimum, or that monetary income that ensures the satisfaction of the minimum allowable needs.
Rational consumer basket - this is the most favorable set of goods and services and their structure, which are calculated on a scientific basis.
1.3.2 Poverty rate
According to P. Townsend, the poor should include those who "do not have enough resources to purchase food, participate in social activities and provide themselves with living conditions that are widely recognized in the society to which they belong."
The most dangerous form of poverty from an economic, social and political point of view is the stagnant form - a situation in which poverty, localized in certain groups of society or in certain regions, is reproduced systematically, i.e. when several generations of people are not able to determine the factors and causes that once gave rise to poverty. Chronic poverty generates the necessary changes in lifestyle, psychology, etc., which begin to act as independent factors.
Temporary poverty is a reversible condition associated either with certain stages life cycle families, either with seasonal fluctuations or with extraordinary circumstances. Manifestations of temporary poverty are relatively less socially dangerous.
1.3.3 Cost of living. Living wage
The cost of living is the cost of goods, life goods, services necessary for a person, family for life, calculated in current prices.
Currently, the cost of living index is considered primarily as an indicator of the dynamics of the general price index for a fixed set of consumer goods and services.
Determining and tracking the cost of living index is especially important in the current conditions of a transitional and inflationary economy, primarily for assessing changes in the standard of living of the population as a result of ongoing socio-economic transformations.
In practice, the calculation of the cost of living index comes down to taking into account the impact on the dynamics of the cost of living of only one factor - changes in consumer prices.
In fact, the factors that determine the dynamics of the cost of living are characterized by a much greater variety than just price changes. The value of the cost of living is affected by changes in the structure of GDP, the structure consumer spending determined along with the prices and conditions of life and work, and the requirements of fashion, and the changing tastes and habits of consumers, and the totality demographic characteristics population.
Also important is the calculation of the cost of living index for use in the practice of regulating socio-economic processes. The prerequisites for using the index in this area are due to the need to quantify the impact of changes in the general level of consumer prices on the dynamics of the standard of living of the population for the purpose of subsequent indexation of monetary income.
The cost of living index can be considered as a socio-economic indicator that makes it possible to assess the real dynamics of prices for a fixed set of goods and services, which characterizes the level and structure of consumption of an average household.
The second after the cost of living index, but no less important concept, belonging to the family of terms of the cost of living category, is the concept of the subsistence minimum.
The living wage determines the level of consumption of goods and services, which is minimal and sufficient to ensure human life, and is determined on the basis of a science-based consumer budget that expresses the minimum physiological needs of a person in food and non-food products and services.
The subsistence minimum budget is one of the central concepts of the system of minimum social guarantees provided by the state to the population.
The scope of the subsistence minimum is very wide: it is an element of the system of minimum social guarantees, and the basis for determining the poverty threshold, and the basis for calculating and differentiating wages, pensions and various benefits. It is used in many calculations related to the provision of pensions, various subsidies and benefits to various categories of those in need.
The subsistence minimum is calculated according to the following formula:
C min i = C fi + C gi + C si + C ti ,
where C min i is the subsistence level of the i-th sex and age group of the population;
C fi is the cost estimate of the food package of the i-th sex and age group of the population;
C gi si ti - indicators of the structure of the subsistence minimum of the i -th sex and age group;
The calculation of the subsistence minimum in prices of a certain period is carried out in the following order: the cost price of the minimum food basket (C fi) is determined by the average prices of goods sold by trade enterprises of all types of ownership based on the registration of prices for specific representative goods. Used in calculations minimum standard food consumption (average per capita, per year in kg).
The subsistence minimum serves as a kind of benchmark in determining the minimum wage, unemployment benefits and other transfer payments. In conjunction with wages, the living wage can play a stimulating role in intensifying labor activity (when the minimum wage is higher than the living wage).
1.3.4 Quality of life
Quality of life is a general socio-economic category that includes not only the level of consumption of material goods and services (standard of living), but also the satisfaction of spiritual needs, health, life expectancy, environmental conditions, moral and psychological climate, and spiritual comfort.
The quality of life is not identical to the standard of living, including the most sophisticated types of its definition, for example, living standards (living standards), since different economic indicators income are only one of many (usually at least 5) criteria for the quality of life. Indicative from this point of view is the situation in the USSR in the 1960s and 1970s, when the quality of life of the Soviet population as a whole was not lower than the quality of life of the population of the leading Western countries, while the standard of living in the USSR was about 2 times lower.
State work to determine and implement the quality of life is carried out through the legislative introduction of standards (indices) of the quality of life, which usually include three blocks of complex indicators:
1. The first block of indicators of the quality of life characterizes the health of the population and demographic well-being, which are assessed by the levels of fertility, life expectancy, natural reproduction;
2. The second block reflects the satisfaction of the population with individual living conditions (prosperity, housing, food, work, etc.), as well as social satisfaction with the state of affairs in the state (fairness of power, access to education and healthcare, security of existence, environmental well-being). To evaluate them, sociological surveys of representative samples of the population are used. An objective indicator of extreme dissatisfaction is the suicide rate;
3. The third block of indicators evaluates the spiritual state of society. The level of spirituality is determined by the nature, range and number of creative initiatives, innovative projects, as well as the frequency of violations of universal moral commandments.
In legal terms, the quality of life is the realization of the right to a decent life and free development of a person. In the Russian Federation, the focus on the quality of life is provided constitutionally. The first part of Article 7 of the 1st Chapter of the Constitution "Fundamentals of the Constitutional System" reads: "The Russian Federation is a social state whose policy is aimed at creating conditions that ensure a decent life and free development of a person."
1.4 State redistribution of income. Social protection of the population
1.4.1 State regulation of income distribution.
Qualitative shifts in the development of production, the growth of production volumes and its quality are impossible without profound transformations in the entire economic mechanism, one of the most important links of which is the regulation of income and wages.
It is known that in a market economy, the state, although in a significantly reduced form, retains its regulatory function. This function extends to the area of income and wages. The regulation of income and wages at the macro level takes place in many countries with developed market economies and is an integral part of socio-economic policy. The state cannot refuse to regulate incomes and wages if market self-regulation mechanisms are not established, if most enterprises do not have a real owner who is interested in restructuring and developing production.
The priority direction in the state policy to regulate the distribution of income should be to increase real wages, for which it is necessary to index them, reduce debts and make payments on it a priority, and adopt laws on compensation for damages in case of non-payment of wages.
It is necessary to speed up the process of bringing the minimum wage closer to the average living wage. To do this, the minimum wage should be freed from the functions of regulating social transfers, since this hinders its increase, because it is associated with significant costs.
For a real increase in income, it is necessary to strengthen the distinction between the taxation of wages and business income, establishing a more preferential procedure for employees and equated employees.
Should be strengthened financial base pensions by increasing the nominal amount of wages, deductions from which form the pension fund.
It is necessary to legislatively, organizationally and economically form a mechanism for regulating the income of the population, taking into account the territorial characteristics of life.
State income stabilization programs are taking place in various countries. But the order of their formation is different.
One part of the funds of such programs is formed through the state budget and is used centrally. The other part of the funds is generated from profits at the enterprises and funds themselves (In the former countries of “state socialism”, about 70% of the funds of such programs were formed from the state budget and only 25-30% of the funds from the profits of enterprises).
Through the channels of state assistance programs, the needs for the education of young members of society, the maintenance of the elderly and the disabled, the provision (in part) of education, and the preservation of health are met. The degree of satisfaction of these needs is determined by the level of economic development prevailing in the given conditions and the value orientations that have developed in society.
The distribution of funds under the assistance programs is carried out in three directions.
The first direction is characterized by the fact that part of the income received by the population depends on labor, but the size of satisfied needs is also taken into account.
The second direction is characterized by the fact that the payments made are not related to the work of this employee, but the size of the needs for the satisfaction of which these payments are directed is taken into account. These payments cover child allowances for workers with many children, single mothers, for specialized treatment, state subsidies for the maintenance of children in children's institutions, in boarding schools. The amount of such a subsidy depends on the number of children and the level of income of the parents.
The peculiarity of the third direction is determined by the fact that the main part of them, acting in the form of benefits and services, goes to the population directly in kind through the relevant institutions of the non-productive sphere. The consumers of a part of state aid are not all working people in general, but only those who have a need for it and only to the extent of this need.
In other words, payments under the aid programs are designed to mitigate differences in income levels caused not by differences in work, but by reasons outside the labor process itself, as well as to help meet a number of needs that are most important from the point of view of the tasks of shaping the ability to work, personal development , achieving higher general educational and cultural levels, affordable health care, and pensions. But since this form of distribution affects the interests of society as a whole and of each of its members individually, the state policy in this area should be especially active.
The purpose of reducing the differentiation of society is the formation of a kind of "middle class" as an adaptation of society - the majority of the population to market conditions.
The presence and growth of the middle class in any country are considered as evidence of the effectiveness of the ongoing reforms, as a criterion that the reforms are going in the right direction and becoming irreversible. The large proportion of the middle class in the system of social stratification is one of the essential features of a society defined as "developed", "civilized".
1.4.2 Social protection of the population
The market system of interaction contains various types of risks, including the risk of loss or reduction in income. State guarantees of compensation for the risk of loss of income (the system of state income support) is the main content of social protection systems. The existing systems of social protection are aimed at maintaining a certain (guaranteed) level of income and consumption of health care, education and other socially weak, low-income strata of the population. The category of low-income includes people with declining or completely lost income as a result of deteriorating health and disability, the birth of children or old age, loss of work or breadwinners, and others. The circle of persons who are the object of social protection is quite heterogeneous and is expanding significantly in the context of the destabilization of the national economy.
A form of social protection in the context of steadily galloping inflation is income indexation, which is used not only as a temporary measure, but also as a permanent element of social protection.
State indexation of income - it is a system of measures that compensates (to an established extent) for the loss of income as a result of an increase in the cost of living. First of all, it is directed to persons receiving fixed incomes. State indexation of income is based on accounting for the increase in the cost of living. The assessment of changes in the cost of living is carried out on the basis of the price index and tariffs for a fixed set of goods and services that make up the consumer basket. Consumer baskets reflecting the volume and structure of family expenses are differentiated by income groups. It is fundamentally important which of the baskets - the minimum or the average - is indexed. In contrast to the consumer basket - a minimum of material security - the structure of consumer spending of the average resident of the country is rapidly changing, so that the set of goods and services included in the consumer basket of the middle class is constantly expanding (the composite index of the cost of living in the 90s is calculated from the consumer basket, including 850 industrial products, 50 agricultural products, 2000 industrial products, 100 kinds of services).
World experience in income indexation shows that this process should be limited and differentiated by categories of income recipients and over time. Income maintenance is carried out in different forms and through different channels. The social protection system is aimed at maintaining real, not nominal incomes, therefore it combines measures that compensate for the loss of cash income and in-kind payments and benefits. The latter include food stamps, systems of state education, education of children and retraining of adults, state medical and social services, etc.
The material basis of the state redistribution of income is public finance. The systems of taxation that operate in modern conditions give, on the whole, a weak effect of redistribution. The progressive effect of direct taxes is usually weakened by the regressive effect of indirect taxes. Note that indirect taxes, as well as all types of subsidies, are reflected in prices, which means that they affect not only nominal, but also real incomes. Moreover, all payers of indirect taxes, including socially weak ones, participate in financing the costs of paying social transfers.
One of the activities of the state in the field of social protection is social support for the unemployed, primarily in the form of unemployment benefits. It is received by persons registered at the labor exchange. Unemployment insurance funds are formed from the contributions of employees, entrepreneurs and budget subsidies. Another form of social support for the unemployed is unemployment assistance, which is either provided at fixed rates (France) or not provided at all (USA, Japan). Another form of social support for the unemployed is various types of compensation that come into effect if the terms for receiving unemployment benefits or unemployment assistance have expired or if a person does not receive either one or the other. They act in the form of payment for certain utilities (public transport, rent), the allocation of funds.
Another area of activity for social support is government programs to create new jobs, improve skills or retrain workers. Such a social policy corresponds to the solution of a two-pronged problem - reducing unemployment or ensuring full employment and restructuring large industries and areas of economic activity and the economy as a whole. Such experience has been accumulated by Sweden, where out of the total amounts allocated for increasing employment and social support for the unemployed, ¾ falls on an active policy in the labor market, ¼ - on various kinds of payments to the unemployed. This policy is implemented through commercial organizations for the retraining of personnel who work on the basis of contracts with the state and enterprises.
2. Social indicators of the Russian economy. The level and quality of life of the population of Russia.
2.1 Principles of formation of social indicators of the Russian economy
Economic systems receive the status of socially oriented in those cases when the state pursues a policy of redistribution of national income on the principles of social justice. It is the concept of the social market economy that underlies the modern economic course of Russia. Her goal- a consistent increase in the standard of living of the population, a decrease in social inequality, the restoration of the country's economic and political role in the world community based on the synthesis of market and state methods of management, a combination of the regulatory role of the state and free market development economy.
Creating a socially oriented economy means:
− achievement of a rational level of consumption for the majority of the population, which implies, in particular, the reduction of differentiation in the level of consumption of goods and services to the extent that incentives for skilled labor and efficient entrepreneurship remain;
− creation of conditions for skilled creative labor, which is closely related to the qualitative change in the structure of the economy;
− transition from a chronic shortage of consumer goods and services to a wide offer in their market;
− formation of an effective system of social protection, which should include protection against unemployment, provision of benefits for disabled groups of the population, connection of the state and insurance systems of social protection;
− In Russia, the creation of a socially oriented economy was difficult due to:
− a strong lag behind modern technical level in a number of industries, especially agriculture, which does not allow you to quickly satisfy the needs of the majority of the population at a high level;
- an extremely irrational structure of the economy with a weak development of industries oriented to the consumer market;
− Preservation of bureaucratic traditions of management, leading to a significant role in economic policy of sectoral interests to the detriment of social tasks;
− predominance in public behavior passive forms social adaptation (dependent moods of some social strata);
− the need for the resumption of economic growth of significant investments for the technological re-equipment of the economy. [ 5]
The Russian economy is most likely developing within the framework of a corporate model, the characteristic features of the social policy of which are a fairly high degree of presence of the public sector in the economy, as well as the coordinating role of the state, which determines the procedure for the redistribution of income, provides economic guarantees, entrusting enterprises with the implementation of social laws ( first of all, this concerns the system of social insurance and social partnership covering the working population). The main measure of quality of life is human development index. It is a composite indicator in the form of a conditional coefficient that reflects health, education level, total resources for consumption and accumulation compared to the subsistence level budget. According to the United Nations (UN), the top 10 places are occupied by Norway, Sweden, Canada, Belgium, Austria, USA, Iceland, the Netherlands, Japan and Finland. According to the results of 2004, Russia was in 62nd place out of 174 states.
The integral components of the country's development programs are socio-economic indicators, which are used as a tool to measure the results of the impact of economic reforms on the standard of living of the population. Failure to comply with these indicators may upset the social balance in the country, so it is necessary to identify a certain starting point, or a minimum level of social well-being, the violation of which can bring the likelihood of a situation of economic danger and instability closer.
Thus, a social indicator is not a means of solving social problems, including those related to economic security, but only a means of studying, foreseeing and managing them. The indicators fix the norms and set guidelines for social development, as well as the most important directions for managing it.
A number of different international and regional intergovernmental organizations are engaged in the development, study and improvement of social indicators within their interests and competence. Thus, the All-Russian Health Organization (WHO) defines indicators of health status and access to health services, and in cooperation with the Food and Agriculture Organization of the United Nations (FAO), indicators of nutrition and malnutrition. UNESCO is improving indicators in the field of education, the International Labor Organization (ILO) - in the field of monitoring employment and unemployment.
The main principles of building a system of social indicators are: scientific validity, taking into account the achievements of the natural sciences (physiology, medicine, etc.) and social sciences (sociology, demography, etc.), the possibility practical application, focus on solving practical social problems of state social policy, the ability to use these indicators to objectively assess the depth of socio-economic problems of a particular region, to make an accurate "diagnosis" to determine the need and amount of assistance from the central government to local authorities to maintain the minimum acceptable level of social security and prevention of social cataclysms. Indicators should take into account the various facets and components of "social welfare" in terms of ensuring the country's economic security (demographic changes, migration and the state of the labor market, the distribution of income and expenses, the development of education and healthcare systems, etc.).
Socio-economic indicators of the standard of living of the population are formed on the basis of statistical data characterizing the volume, composition, main directions of use and distribution between individual groups of the population's monetary income, as well as, with the involvement of other data, reflecting the final result of economic and social policy in areas affecting various aspects of the welfare of the population.
Socio-economic indicators are expressed in terms of average and median values, rates of change, coefficients of frequency, concentration, differentiation and purchasing power. The calculation of socio-economic indicators is carried out in accordance with general requirements on the formation of macroeconomic indicators and taking into account the specifics of the system of statistical social indicators.
The main initial indicators used in the calculation of socio-economic indicators are:
− Household disposable income.
− Disposable income.
− Household final consumption expenditure.
− Monetary incomes of the population.
− Monetary expenditures and savings of the population.
The publication of socio-economic indicators of the standard of living of the population is made on a monthly basis in the reports of the State Statistics Committee of Russia "On the socio-economic situation" in accordance with the following list:
− Average per capita cash income are calculated by dividing the total amount of money income for the reporting period by the number of the actual population.
− Real disposable money income are determined based on the cash income of the current period minus mandatory payments and contributions adjusted for the consumer price index.
− Average monthly salary employees in sectors of the economy is determined by dividing the accrued monthly wage fund by the average number of employees.
− The average amount of the assigned monthly pension is determined by dividing the total amount of assigned monthly pensions by the corresponding number of pensioners.
− Purchasing power of the population reflects the potential of the population to purchase goods and services and is expressed through the commodity equivalent of the average per capita monetary income of the population and the ratio of the monetary income of the population to the subsistence minimum.
− Distribution of the population according to the level of monetary income characterizes the differentiation of the population according to the level of material prosperity and represents indicators of the number (or shares) of the population grouped in given intervals according to the level of average per capita cash income.
− Distribution of total cash income by different groups of the population expressed as a percentage of the total amount of money income, which each of the 20 (10) percent groups of the population has.
− Income differentiation coefficients: set the amount of excess cash income of high-income groups in comparison with low-income groups of the population.
− Income differentiation coefficient (Gini index): sets the degree of deviation of the actual volume of distribution of incomes of the population from the line of their uniform distribution.
− Living wage is a cost estimate of the subsistence minimum: a natural set of food products that takes into account dietary restrictions and provides the minimum required number of calories, as well as expenditures on non-food goods and services, taxes and mandatory payments, based on the share of expenditures for these purposes in the budgets of low-income households.
− Population with incomes below the subsistence level is determined on the basis of the distribution series of the population by the level of average per capita monetary income and is the result of summing up the number of persons whose monetary income is below the subsistence level.
− income deficit is determined on the basis of data on the number and size of incomes of the population with incomes below the subsistence level and is calculated as the total value of income necessary to increase it to the subsistence level.
2.2 The level and quality of life of the population of modern Russia
2.2.1 Living standards indicators
The level and quality of life of the population are the most important indicators of the correctness of the development of the economic course. The decline in well-being is unacceptable not only for humanitarian reasons, but also for economic ones, as it undermines incentives for effective activity.
The concept of "quality of life" is used very widely, but it does not have a generally recognized formalized structure and a standard set of indicators. Priorities depend on the needs of people, closely related to the level of development of countries and regions, so the criteria for assessing the quality of life do not match for developed and developing countries. The most complete list of quality of life components used in international comparisons and national assessments of developed countries includes the following blocks:
− income of the population;
− poverty and inequality;
- Unemployment and use of the labor force;
− dynamics of demographic processes;
− education and training;
− health, food and nutrition;
− condition of the dwelling ( settlements), infrastructure, communications;
− resources and the state of the natural environment;
− culture, social ties, family values;
− political and social stability (security);
− political and civil institutions (democracy and participation).
Quality of life assessments are identified through objective (statistical) and subjective (results of sociological research) measurements based on regular mass surveys of the population or expert assessments.
The indicator of the standard of living can be expressed as the ratio of income (expenditures) and the cost of living. The dynamics of the purchasing power of the population determines the varying degree of satisfaction of needs and, consequently, the different levels of social well-being. It can be most reliably assessed by a system of indicators reflecting various levels of the population's well-being: from poverty to high wealth.
So far, official statistics have mainly used indicators of the subsistence minimum, average per capita income and average wages, which are compared with each other and other social indicators. However, this is currently not enough.
The living wage in its current form cannot be regarded as an economically and socially justified limit of the “normative” standard of living (such should be the minimum consumer budget). In assessing the real purchasing power of the money incomes of various groups of the population, the average wage cannot serve as an indicator of the standard of living either. In particular, it does not reflect the actual level of income received, since it does not include illegal income of citizens and does not allow taking into account such a characteristic feature Russian market labor, as a large secondary, including unregistered, employment of the population.
With a significant stratification of property, large regional differences in the standard of living of the population, the average indicators of the standard of living cannot at all play the role of social indicators of the economy. It is necessary to use a system of relative (rather than absolute) indicators, namely, the ratio of average per capita income to the subsistence minimum, minimum and rational consumer budgets. At the same time, data on the change in the share of the population group with incomes below the subsistence level, the concentration of income in various population groups and the ratio of income and the number of the poorest and richest people are extremely important.
The system of consumer budgets should be supplemented by social standards that reflect the level of provision with state social guarantees in the areas of: housing (standards for area per person), employment (conditions for the provision and amount of unemployment benefits), education (duration and quality of free education), healthcare (a set of free medical services), etc.
When using social indicators, it is important to distinguish between the elements of social assistance and social support. In the first case, it is assumed that the state will fully or partially reimburse the minimum costs of human existence at the level of national social standards (direct material assistance to those in need and subsidies for the functioning of the sphere social service). In the second case, the appropriate funds are spent on mobilizing the abilities of the population, providing it with opportunities to improve economic activity and improved self-reliance.
It is necessary to determine the maximum permissible parameters for reducing the level of social security, exceeding which leads to destructive processes in society and the economy. As a "threshold" indicator of a socially threatened situation, it is advisable to use a composite index of the level of consumption, below which one cannot fall, and the subsistence minimum.
2.2.2 Living wage
The federal law "On the composition and structure of the subsistence minimum in the Russian Federation" was adopted in November 1999. and entered into force on January 1, 2000. It was drawn up on the basis of the norms of the Federal Law of November 20, 1999 N 201-FZ "On the consumer basket as a whole in the Russian Federation."
According to this law, the cost of living is understood as the valuation of the consumer basket, as well as mandatory payments and fees. In turn, the consumer basket is the minimum set of food products, non-food products and services necessary to maintain human health and ensure its vital activity.
To calculate the subsistence minimum, a set of 25 basic foodstuffs is calculated. This set is developed on the basis of norms corresponding to the minimum size of consumption. The guidelines used in this set are based on globally accepted nutritional limits. This set was developed by the Institute of Nutrition of the Russian Academy of Medical Sciences together with the Institute of Socio-Economic Problems of Population of the Russian Academy of Sciences and the Ministry of Labor of the Russian Federation.
The set of 25 staple foods includes: rye-wheat bread (68.7 kg), wheat bread (62.9 kg), wheat flour (19.5 kg), rice (3.7 kg), millet (9. 8 kg), vermicelli (5.2 kg), potatoes (124.2 kg), cabbage (28.1 kg), carrots (37.5 kg), onions (28.4 kg), apples (19.4 kg), sugar (20.7 kg), beef (8.4 kg), poultry (17.5 kg), boiled sausage (0.45 kg), semi-smoked sausage (0.35 kg), frozen fish (11, 7 kg), milk (123.1 l), sour cream (1.6 kg), animal butter (2.5 kg), cottage cheese (9.9 kg), cheese (2.3 kg), eggs (151.4 pcs.), margarine (3.9 kg), vegetable oil (6.4 kg). Norms are given per year.
The choice of this list is explained by the relative stability of the presence of marked goods on sale, which makes it possible to reasonably analyze the dynamics of the cost of a set of products. To take into account the influence of various natural and climatic zones and local conditions, the whole country is divided into 16 zones that affect the food consumption pattern in different ways.
The following set of services "fit" into the minimum consumer basket per person: 18 square meters of living space, central heating - 6.7 gigacalories per year, water - 285 liters per day, gas - 10 cubic meters per month, electricity - 50 kilowatt-hours per month. In addition, public transport costs are calculated: for a man of working age - for 602 trips, for a woman - for 638 and for children aged 7-15 years - 600 trips per year. Transport services for pensioners and children under the age of six are not included in the minimum set of services.
The subsistence minimum is calculated by the state statistics authorities per capita for the country as a whole on a quarterly basis. These calculations are made for the entire population and its main socio-demographic groups.
It should be noted that the subsistence minimum as a whole fairly objectively reflects the dynamics of prices and the level of well-being of the population.
Statistics also knows another socio-economic indicator of the life of the population - the so-called minimum consumer budget. Its value is also calculated and characterizes the valuation of goods and services of a higher level compared to the subsistence level. In other words, the minimum consumer budget ensures the normal reproduction of the labor force for the working and the vital activity for the disabled - however, also at a minimum. A more or less normal life by Russian standards begins with incomes 2.5 times higher than the subsistence level.
2.2.3 Purchasing power of household income.
The purchasing power of the population's income directly depends on the level and price indices. The question of the purchasing power of the population's income is just as correlated with the cost of living as it is with the income of the population.
Over the past years of reforms, in general, there has been a significant devaluation of basic cash income, which indicated a sharp deterioration in the standard of living of the majority of the population in terms of its financial and purchasing capabilities.
Purchasing power is expressed not only through the ratio of monetary incomes of the population to the subsistence minimum, but also through the commodity equivalent of average per capita income, in other words, through the ratio of the latter to the average price of a product or group of goods for the corresponding period of time.
In particular, as the table data show, for 1990-1995. there was a sharp decline in purchasing power for almost all food products. Currently, the purchasing power for the most socially important group of goods, including bread, bakery products, as well as flour, has increased significantly.
Table 1 - Purchasing power of the average monthly nominal accrued wages(per month; kilograms)
| 1970 | 1990 | 1995 | 2000 | 2001 | 2002 | 2003 | 2004 | 2005 | |
| Foodstuffs | |||||||||
| Beef | 54,3 | 95,9 | 45,2 | 39,5 | 40,8 | 49,3 | 61,7 | 66,2 | 65,2 |
| Pork | 51,7 | 90,2 | 37,4 | 46,0 | 45,2 | 54,2 | 68,8 | 59,6 | 58,2 |
| Whole milk, l | 403,3 | 1010,0 | 218,4 | 305,1 | 353,4 | 435,4 | 494,0 | 523,3 | 574,4 |
| Cottage cheese | 113,1 | 315,6 | 64,8 | 75,4 | 81,9 | 98,1 | 113,2 | 117,6 | 125,8 |
| Rennet cheeses | 48,0 | 111,8 | 22,9 | 27,3 | 32,6 | 43,4 | 50,6 | 58,0 | 63,8 |
| Eggs, pcs. | 1071 | 2755 | 1217 | 1657 | 1953 | 2509 | 2967 | 2997 | 3578 |
| Fresh fish | 151,3 | 288,6 | 67,2 | 74,2 | 83,8 | 95,5 | 109,8 | 126,8 | 137,6 |
| Sugar | 136,0 | 336,7 | 127,8 | 185,7 | 208,8 | 264,4 | 280,0 | 343,6 | 429,9 |
| Sunflower oil | 73,3 | 177,2 | 57,9 | 94,2 | 125,2 | 121,3 | 148,7 | 176,1 | 213,8 |
| Butter | 34,6 | 86,6 | 24,2 | 34,4 | 46,8 | 59,6 | 66,4 | 75,5 | 87,4 |
| Potato | 806,7 | 704,7 | 274,3 | 384,0 | 528,9 | 517,8 | 538,0 | 818,8 | 839,9 |
| fresh cabbage | 930,8 | 891,2 | 230,8 | 424,1 | 423,5 | 463,7 | 487,8 | 809,8 | 687,1 |
| Onion | 355,9 | 513,6 | 194,6 | 322,8 | 362,8 | 356,6 | 386,3 | 504,9 | 665,0 |
| Beetroot | 355,9 | 513,6 | 216,3 | 343,8 | 458,7 | 415,5 | 413,6 | 641,0 | 617,1 |
| Carrot | 355,9 | 513,6 | 187,3 | 287,3 | 357,7 | 343,5 | 384,4 | 559,2 | 554,4 |
| Apples | 131,5 | 125,2 | 90,8 | 96,1 | 126,8 | 144,9 | 167,5 | 200,7 | 233,8 |
| Citrus | ... | 97,7 | 80,9 | 94,3 | 105,9 | 139,1 | 159,1 | 186,2 | 223,1 |
| Bread and bakery products made from wheat flour | 448,1 | 776,9 | 187,8 | 223,1 | 282,7 | 360,1 | 394,5 | 369,8 | 448,7 |
| Wheat flour | 336,1 | 704,7 | 245,1 | 277,3 | 380,2 | 530,7 | 600,2 | 509,9 | 687,9 |
| Peas and beans | 295,1 | 673,3 | 219,2 | 164,4 | 245,7 | 341,0 | 443,9 | 465,5 | 578,5 |
| Rice | 144,1 | 365,1 | 143,0 | 155,2 | 244,1 | 290,0 | 345,7 | 375,2 | 405,2 |
| cereals | 302,5 | 582,7 | 202,1 | 219,2 | 345,3 | 461,9 | 423,0 | 460,7 | 625,7 |
| Pasta | 224,1 | 505,0 | 91,7 | 131,6 | 175,8 | 214,5 | 272,4 | 282,4 | 334,6 |
2.3 Social indicators of the Russian economy during the reform period
2.3.1 Personal income indicators
Social indicators of the economy were used as a tool to measure the results of the impact of Russia's economic reforms transition period on the standard of living of the population. ( Table 4, Appendix B)
With their help, they studied social problems, adjustments were made, plans for further development were made. This period of the modern history of the country is of particular interest in the light of the topic under study.
The transition to a market economy in Russia was accompanied by a sharp decline in the standard of living of people, an unprecedented increase in income stratification of the population, as a result of which a gap formed between poverty and wealth. Rising process economic inequality, the impoverishment of a significant part of the population, on the one hand, and the formation of a small layer of the rich, on the other, began as early as the period of perestroika and intensified during the transition to large-scale privatization of state property by 1993. This trend remained virtually unchanged in the next few years.
Let us consider the dynamics of real incomes over the years of reforms (Appendix A, Table 3). As a starting point for comparison, let's take 1991, which preceded radical changes in the level of real incomes. The dynamics of real per capita cash incomes, wages and pensions over the years of market reforms indicates two periods of their decline and subsequent recovery growth: the first was caused by price liberalization in January 1992, the second is associated with financial economic crisis in August 1998. Let us briefly characterize each of them.
Inflationary processes in the Russian economy began much earlier than 1991. and were expressed not so much in rising prices, but in deepening the shortage of goods and services, spreading speculation and shadow economy. However, the growth of nominal incomes still outstripped the growth of prices for goods and services. In fact, a significant decline in real incomes began after the administrative increase in state retail prices on April 2, 1991, despite the so-called "compensation" paid to all citizens at the same level. In 1992, the liberalization of prices for consumer goods and services or, as it is called, "shock therapy" led to an even sharper depreciation of the income of the entire population. The rapid rise in prices for consumer goods and services (the composite price index amounted to 26 times), outpacing the increase in nominal income (11.3 times), caused in 1992 a drop in real incomes by more than 2 times - to 43.7% of the previous year . As a result, the per capita income of almost 80% of Russian families turned out to be below the cost of the minimum consumer basket, and only after its revision, the share of Russians below the poverty line by the end of 1992 amounted to 1/3 of the total population.

Rice. 1.2. Dynamics of real incomes, wages and pensions, %
An analysis of changes in the real incomes of Russians over the five years of the first recovery growth (1993–1997) showed that it was unstable and more of a periodic nature.
In general, for the period 1993-1997. the overall average annual growth in real money income (taking into account the fall in 1995) was 117%, and in 1997 income was 59.4% of the 1991 level.
The volume of arrears in the payment of wages, pensions and benefits amounted to 3.22 billion rubles in 1994, 7.8 billion rubles in 1995, 45.5 billion rubles in 1996, and 45.5 billion rubles in 1997. - 69.4 billion rubles.
The financial and economic crisis in August 1998, which caused a rapid rise in prices for consumer goods, interrupted the trend of recovery growth in household incomes.
The decline in real incomes in 1998 on average compared to 1997 was 16%. However, real incomes in December 1998 amounted to 42.5% of the 1991 level.
As a result of the crisis, the decline in production continued (the decline in GDP amounted to 5%), the arrears of wages, pensions and child benefits increased sharply (by 1.8 times compared to previous period), which amounted to 123.2 billion rubles in monetary terms. (the maximum value for the entire period of market reforms), finally, there was a significant increase in the proportion of the poor.
Along with the negative consequences, the financial and economic crisis of 1998 gave a certain impetus to the expansion of employment, the continuation of the process of market adaptation and, as a result, the recovery growth in household incomes. The prevailing favorable trends in the economy have created conditions for economic growth. However, in the first post-crisis year of 1999, despite the growth of GDP (6.4%), the process of further decline in the standard of living continued: real money incomes fell by another 12% on average over the year.
An increase in the income of the population took place only by the end of 1999; real money income grew by 10.1% and amounted to 46.9% of base period.
Income growth in 2000 was significantly affected by the indexation of pensions and salaries of employees of budget organizations, as well as further reduction of wage and pension arrears. Thanks to these processes, as well as in connection with a significant improvement in employment indicators, the average annual growth in real money income amounted to 113.4%.
In the third post-crisis 2001. the dynamics of income was significantly affected by the indexation of pensions, the increase in wage rates for employees of budgetary organizations and the increase in wages at enterprises. As a result, the monetary incomes of the population increased by another 10% and reached 52.4% of the base level.
2003 was the most successful year of market reform in Russia. Thus, the economy continued to experience positive changes: economic growth was 6.7%, inflation fell to 12% of the 1997 level, the average annual income growth was 13.4%, the proportion of the poor has significantly decreased (to 20.6% compared to 25% in 2002) . In subsequent years, positive trends in the overall dynamics of income continued, but there was a decrease in growth rates.
Monetary income for this period 2000-2003. increased by 1.57 times, amounting in 2003 to 83.5% of real incomes in 1991. Such high rates income growth exceeded the rate of economic growth by almost 2 times.
The main source of cash income is the wage fund. After the fall in January 1992, the recovery growth in wages was much slower than the increase in income: if the average annual real growth income for the period 1993-1997. amounted to 116.9%, wages in real terms did not increase, but rather decreased by 31.6%, amounting to 41.2% of the base period. Thus, during the crisis period of the Russian economy, the labor market reacted to the decline in GDP by reducing employment and wages. At the same time, most employers preferred to reduce wages and not reduce the number of employees. It is this policy that has led to the fact that at present there are unreasonably many low-paid jobs, and half of the Russian poor are the working poor.
In order to prevent a low level of wages and social protection of the population, in December 1991, adopted Law "On the minimum wage"(minimum wage) in the amount of 200 rubles. per month. The real value of the minimum wage is constantly falling due to inflation. The Government of the Russian Federation, seeking to somewhat protect the minimum payment from depreciation, carries out its indexation. During the period from 1991 to 1997, the minimum wage increased 16 times, however, despite the changes, it lagged behind the inflation rate and did not correspond to the real content of the Russian monetary unit.
For state budgetary organizations (schools, universities, hospitals, theaters, etc.) in 1992, Unified tariff scale(ETC), which determined the level of payment and its differentiation by categories of workers. It classifies public sector workers into 18 categories and determines its own coefficient for each category from 1 to 10.07. The tariff rate of the first category was set at the time of the introduction of the ETC in the amount of 1800 rubles, the remaining categories were determined by multiplying the tariff rate of the 1st category by a coefficient.
However, despite the measures taken, payment in the public sector remained 1.5-2 times lower than in industry, it ranged from 95 to 123% of the subsistence minimum. With regard to such cash income as state social transfers, as of January 1, 1999, the average size monthly pensions, for example, taking into account compensation payments amounted to 403 rubles, which is equal to 72.1% of the subsistence minimum.
The difficult years of reforms gave impetus to the process of deterioration demographic situation in Russia. At present, the ratio of workers and pensioners is 1.7:1, and by 2010, according to some forecasts, this ratio may reach 1:1 (while in developed countries it is 2.2-2.4:1) .
During the August 1998 crisis, the average salary in the country fell to its lowest point - 27.3% of the calculation base (Appendix A, Table 3)
The year 2000 was marked as the year of the highest growth in wages, primarily due to the indexation of wages for employees of budgetary organizations, as well as a further reduction in wage arrears: from 43.7 to 31.7 billion rubles. Thanks to this, as well as a significant improvement in employment indicators, the average annual growth in real wages was 120.9%, rising to 33.9% of the comparison base.
2.3.2 Income differentiation and poverty
The reform of the Russian economy was accompanied by a deep economic crisis, unemployment and a drop in the living standards of the majority of the country's population, a sharp stratification in society and social and property differentiation of the population. These circumstances brought to the fore, among other important problems of socio-economic policy, the task of overcoming poverty as a top priority.
Appendix B data, fig. 1 clearly show the process of redistribution of the amount of cash income between the 20% groups, which began in 1992, when the share of incomes of the 20% of the poorest population fell immediately by 2 times: from 11.9% in 1991 to 6% in 1992 .
The aggravation of the polarization of society can be seen by comparing the decile groups of households of the richest and poorest. In 1998, the 10% richest group had an income of 2023.5 rubles. per month (on average per member of the household), and the ten percent group of the poorest - 204.5 rubles. per month, i.e. almost 10 times less. This gap is somewhat larger if we compare the monetary incomes of the population as a whole (13 times). These indicators adequately reflected the real situation of the Russian population.
Poverty is a low level of cash and in-kind incomes that are insufficient to meet basic vital (biological) needs - housing, food, clothing, services. The economic literature recognizes the share of the population with incomes below the subsistence minimum as an indicator of the country's poverty. The ratio of per capita distribution resources of households and the subsistence minimum indicates a low standard of living a large part of the population of Russia, and the dynamics of this ratio - about the deterioration of the situation of the population of the country during the years of reforms. In 1997, the share of all households below the subsistence minimum amounted to 25.7%, and in 1998. - 30.4%
In the transitional economy, along with the traditional types of poverty - stagnant and temporary - the so-called new poverty has appeared - sections of the population that, by their education and qualifications, social status and demographic position, have never previously belonged to the lower stratum of society. The drop in incomes of these people was caused primarily by the low level of wages in state-owned enterprises and in scientific organizations, unemployment and part-time employment, late payment of wages and pensions.
The high level of poverty of the Russian population required the state to carry out various measures to support people below the poverty line.
Since 2000, there has been a trend towards a gradual decrease in the number of people with monetary incomes below the subsistence level. In 1995, 24.8 percent of the country's population had incomes below the subsistence level. As a result of the direction of the state policy aimed at improving the quality and standard of living of the population, in the period from 2000 to 2004. this indicator decreased from 29% to 17.6%
Favorable trends in the Russian economy in 2000-2003 had a positive impact on the general macroeconomic indicators of incomes and living standards of the population. During these years, there was a real increase in the population's money income, including wages, which amounted to about 10% per year. However, this trend was largely due to the outstripping income of wealthy citizens, whose share was only about a fifth of the population. At the other extreme, there is a significant poor part of the population whose incomes are below the subsistence minimum, as well as needy groups with incomes slightly higher than the subsistence minimum.
According to estimates of specialists in socio-economic stratification, in our country by 2002:
a) about 50 million people (i.e. a third of the population) were in an extremely difficult situation, unable to even provide themselves with good nutrition;
b) there was an increase in poverty both in terms of specific weight and categories of the population (in addition to the disabled, large families and single-parent families, as well as the unemployed, this group increasingly included numerous categories of working citizens);
c) the share of the "middle class" was unjustifiably low, which reduced the potential for reforms;
d) the share of 20% of the wealthiest citizens accounted for more than 50% of cash income, and the share of 20% of the least wealthy - only 6%.
The problem of social stratification by income remains relevant for the country at the present time. According to approximate data, today in Russia:
- about 1.5 million very rich people, including dollar millionaires. To enter this group, a family of three must have an income in excess of $50,000. in year. The main sources of income for the vast majority of this group are income from property, business activities and financial income management. It is they who acquire luxury real estate, expensive foreign cars, antiques and works of art. Their children study in Europe and the USA. The savings rate in such families reaches 30% or more.
− About 6 million people have from 500 to 1250 dollars per month for each family member (20-45 thousand dollars per year for a family of three). This group includes both citizens who have received income from property and entrepreneurial activities, as well as highly paid professionals. They buy typical mass housing, inexpensive foreign cars and new Russian cars, expensive household appliances and clothes. Their children study at prestigious Russian universities. These families do not spend 15-20% of their income on current consumption, but save to some extent. This group is dominated by liberal sentiments.
− 22 million people have an income of 250 to 500 dollars per month for each family member (10-20 thousand dollars per year for a family of three). This group is dominated by relatively highly paid professionals, employees - managers, engineers, auditors, consultants, etc. They buy slightly used cars, household appliances of the middle price segment. The savings rate for this group of families is about 12%. They are against direct intervention in the economy, but do not object to a more active social policy.
- About 30 million people earn from 160 to 250 dollars a month for each family member, 6-10 thousand dollars. per year for a family of three. It is formed by ordinary employees of relatively prosperous organizations in the following industries National economy: oil industry, energy, transport, communications, mechanical engineering, etc. Representatives of this group purchase inexpensive household appliances, rarely go to bars and restaurants, the savings rate is about 8%. Many members of this group advocate an active industrial policy by the state, job security, redistribution of income and property.
− About 45 million people live, according to Russian standards, in poverty. Their income is from 75 to 150 dollars per month, and family - 3-6 thousand dollars per year. This group included workers from disadvantaged industrial enterprises, the social sphere, and working pensioners. All current incomes of the representatives of this group go to the purchase of food and consumer goods. When choosing, they are forced to focus on the most low prices. These families practically do not make savings.
− About 40 million people (more than a quarter of the country's population) live in poverty. Their income is less than the living wage. In addition to the marginalized (alcoholics, parasites, etc.), this group included non-working pensioners, the disabled, social workers, and large families.
The fight against poverty is one of the most important strategic tasks of the democratic development of society. The anti-poverty program should be carried out in conjunction with programs of long-term economic growth and investment, stabilization of the monetary system, employment and job creation.
The initial task of a national scale in Russia is to increase the minimum wage to the subsistence level over the next few years (according to the ILO, the minimum wage in most countries of the world is 40-60% of the average wage and is several times higher than the physiological subsistence level), and the quality of life of the population of the country.
2.2 Social indicators - guidelines for the economic development of modern Russia
Let us consider the main social indicators of the economy of modern Russia, the indicators of which allow us to draw conclusions about the correctness of the country's development course, to adjust the further steps of the state aimed at improving the level and quality of life of the population.
In recent years, despite economic growth, the negative consequences of the period of market transformations continue to persist in Russia, such as high mortality, low birth rates, unemployment, and social stratification of the population. The incomes of citizens remain low, which indicates the low level and quality of life of Russians.
The natural and unnatural decline in the population of Russia today is perceived by society as an indisputable and ordinary fact. In the meantime, according to the UN forecast, the population of Russia will decrease to 100 million people by the middle of the century, that is, we will become less by 42.7 million.
The forecasts of various domestic organizations are also disappointing: the State Statistics Committee of the Russian Federation assumes a 30% reduction in the population by 2050 (2020 - 130 million, 2030 - 121.5 million, 2040 - 111.6 million, 2050 - 101, 9 million people).
Let's take indicators of the quality of the nation's health. In terms of healthy life expectancy, Russia ranks 142nd in the world. Child mortality, according to UNICEF, in Russia is 3-4 times higher than in developed countries. And the trend is not encouraging. If in the civilized world life expectancy tends to reach the level of 80 years by the middle of the century, in Russia the expected parameter for men is 51 years, for women - 62 years (now 59 and 71).
According to the calculations of the Institute for Demographic Research of the Russian Academy of Sciences, the birth rate in the period up to 2015-2020. will decrease to 1.01 children per couple (the norm is 2.14, today it is actually 1.34).
The population is aging rapidly. Today, there are 1.3 pensioners per worker. Soon he will feed at least two pensioners. Proportion of people over working age by 2050 will increase by more than half (from 21% to 35%). If the current level of mortality remains unchanged, among Russians who reached the age of 16 in 2000, less than half of the men will live to 60.
According to doctors, over 70% of the Russian population lives in a state of prolonged psycho-emotional and social stress, depression, reactive psychosis, severe neuroses and psychosomatic disorders, alcoholism, drug addiction, and antisocial outbreaks. 40,000 citizens voluntarily die each year. And 190 thousand people die from harmful and dangerous industries.
With regard to the level of general unemployment, the average for the North-West, for example, in early 2007. he made up over 6%.
The incomes of citizens remain low. According to information from Rosstat for 2006. the income gap between the richest Russians and the poorest increased from 15.1 to 15.4 times.
An important indicator is wages, which in February 2007 averaged 11,659 rubles and increased by 26.4% compared to February 2005. However, the minimum wage remains low, which still lags behind the subsistence minimum.
Sociological surveys are conducted to find out among Russians their opinion about the quality of their life. We present the results of one of them as an example.
In particular, according to the VTsIOM data for the last January, due to a lack of funds in 2006. 52% of citizens refused to travel for recreation and vacations, which, by the way, is even 3% more than two years earlier. During this time, the number of those who have the opportunity to use paid educational (from 18 to 16%) and medical (from 21 to 17%) services has also slightly decreased.
48% of Russians, according to the same VTsIOM, experienced practically no changes in their income over the year, 29% of respondents reported their growth and 20% indicated a decrease. However, a more detailed examination of the indicators turned out that the largest number of citizens with increased incomes represent the group of well and very well off (59%) and, conversely, the smallest (13%) - among those who are financially ill and very ill. It is clear that the picture is reversed in terms of income decline: 6 and 38%, respectively.
In the past year, have you had to give up any of the following because you didn't have the money to do so? (%)
How would you rate the change in your and your family's income levels over the past year? (%)
In general, the existing problems require a radical turn towards the development of the social sphere, reforming the system of income redistribution. This is the task of the Government of the Russian Federation, in the main directions of the socio-economic policy of which it is planned to 2010. ensure Russia's access to a qualitatively new level of development, characterized by a growing economy, an efficient state, the presence of an independent middle class, and stable social and political relations. In the medium term, it is necessary to prevent an increase in the gap between Russia and developed countries, and in the long term, to restore and strengthen its position as one of the world leaders in development.
In order to improve the welfare of the population, reduce poverty, and provide the population with high-quality social services in the medium term, the total budget expenditures per capita in Russia are planned to be increased to 5.8 thousand rubles. in 2008
The indicator of the planned growth of wages of employees of the public sector in the period from 2005-2008 is presented in Table 2.
Table 2. Indicators of wage growth for employees of the public sector in the period 2005-2008
Commenting on the draft federal budget for 2007, Deputy Prime Minister of the Government of the Russian Federation A. Zhukov noted: “The real incomes of citizens should grow by more than 10% next year. Despite the increase in expenditures, the 2007 budget will be balanced, which will allow reducing inflation rates.”
The problem of raising the minimum wage to the level of the subsistence minimum remains a widely discussed issue, since Russia still does not comply with Article No. 133 of the Labor Code of the Russian Federation, which proclaims that "the minimum wage ... cannot be lower than the subsistence level of an able-bodied person." Simply put, the state must guarantee to every working citizen such an income that will allow him to feed himself and satisfy his most basic needs. Now the minimum wage is 1,100 rubles, and the subsistence minimum is about 3,700.
A. Kudrin, commenting on the draft federal budget for 2008-2010, announced the plans of the Government:
“In the social sphere, the document of the Ministry of Finance promises an increase in wages in the public sector and, by the beginning of 2011, an increase in the minimum wage to the subsistence level. It is planned that the indexation of salaries of public sector employees annually will not be lower than the rate of inflation. average salary will grow from 13.1 thousand rubles a month in 2007 to 20.8 thousand rubles in 2010. The share of people with incomes below the subsistence level will decrease from 16 percent in 2006 to 10.7 percent in 2010. The average pension will increase from 3.1 thousand rubles a month in 2007 to 5.1 thousand rubles in 2010”.
The priority tasks of the social and economic development of Russia were set by the President of the Russian Federation V.V. Putin in his Address to the Federal Assembly of the Russian Federation on April 26, 2007.
Vladimir Putin noted: "Whatever tasks we solve - in culture, the economy or the social sphere, we must look for the most effective ways and methods for their implementation."
He dwelled on the first results of the implementation of priority national projects. "Their main goal is to invest in people, in improving the quality of life."
According to the Head of State, "the reduction in mortality and the increase in the birth rate, achieved in 2006 and in the first months of this year, is an obvious evidence of the correctness of our efforts."
The Address noted that a negative indicator of the Russian economy is a significant gap between the poor and the rich.
“In general, I consider the state’s inattention to these problems to be immoral. A country with such reserves accumulated through oil and gas revenues cannot tolerate the fact that millions of its citizens live in slums.”
The problem of social security of citizens remains topical. “We need to face the truth and admit that today, without the support of the state, many of our fellow citizens, who find themselves in the most difficult, difficult living conditions, are not able to solve this issue on their own. ... It is here that the roots of many acute problems lie, such as drunkenness, high mortality, crime, including juvenile. Homelessness, after all."
So, the latest steps taken by the President and the Government of the Russian Federation are aimed at stabilizing the country's economy with priority development of the social sphere. Russia, overcoming the negative consequences of the period of transition to a market economy, is consistently moving towards improving the welfare, level and quality of life of the country's population.
Conclusion.
Income, being one of the characteristics of the standard of living of the population, reflects the state and efficiency of the economy of any country.
One of the most difficult problems associated with income is the problem of their equitable distribution.
For our country, this issue arose very acutely in connection with the restructuring of the economy and the transition to market relations after the collapse of the USSR, where people were in more or less equal conditions. The formation of market relations in Russia was accompanied by a rapid increase in inequality in the distribution of income, the growth of a number of negative phenomena in society and the country's economy. During the years of reforms, the standard of living of the population dropped sharply, there were cardinal changes in the distribution of income, which led to an unprecedented stratification of society into the poor and the rich. The state in these conditions could not provide its citizens with a decent standard of living and social guarantees.
Any country that has taken a course on market relations is faced with such a problem as poverty. But in Russia, the level of poverty was very high, while the peculiarity was the insufficient formation of the "middle class". Changes in the incomes of the population and stratification in society posed serious social problems for the state, which required the authorities to address them immediately. Without this, it was impossible to develop a market economy. As guidelines for the correctness of the chosen course, tools for measuring the results of the impact of economic reforms in transitional Russia on the standard of living of the population, such socio-economic indicators as incomes of the population, wages, cost of living, the subsistence minimum, etc. were used.
The main goal of the state's social policy was to reduce the stratification of society, equalize the standard of living in various regions of the country, and social protection of the poor part of the population, which is carried out through the mechanism of redistribution of income. Of great importance was the creation of conditions for increasing the income of the population by legislatively establishing a minimum wage equal to the subsistence minimum, which has not been achieved so far and is planned to be implemented only by 2011.
For Russia, the development of a significant layer of the “middle class” remains relevant, which is an indicator of a higher level of well-being of society, if necessary, at the same time, the presence of poor and rich sections of the population. Such a division is inherent in the very essence of a person, however, it should not take on threatening forms, and the efforts of the state with a market economy should strive to equalize the incomes of the population and increase the level and quality of life.
Currently, the strategic directions of Russia's development require a significant increase in the effectiveness of social policy, which today is no longer considered only in the context of mitigating the negative consequences of reforms and supporting the poor. Among the current priorities are the creation of conditions for further growth in the welfare of citizens, an increase in the income level of various groups of the population, a reduction in the gap between wealth and poverty, a significant increase in wages for public sector workers, and the solution of housing problems.
The prospective programs of the Government of the Russian Federation outline measures of the state's regulatory influence on the real processes of development of modern Russian economic system, an important indicator of the effectiveness of which is the increase in incomes of the population. In Russia, as President of the Russian Federation V.V. Putin noted in his Address to the Federal Assembly, this figure has doubled since 2000, which undoubtedly means an improvement in the quality of life of Russians and a desire to approach the standard of living of the population of countries with a socially oriented market economy. economy.
List of sources used:
1. The Constitution of the Russian Federation. Adopted by popular vote on December 12, 1993. M.: Izvestia, 1995.
2. Labor Code of the Russian Federation / M.: Yurait-Izdat, 2005. - 218p.
3. Raizberg B.A. Modern Economic Dictionary [text] / Raizberg B.A., Lozovsky L.Sh., Starodubtseva E.B. - M.: INFRA-M, 2004. - 480 p.
4. Surinov A.E. The income of the population. Experience of quantitative measurements. [text] / Surinov A.E. - M.: Finance and statistics, 2000, - 244 p.
5. Bulatov A.S. Economics: Textbook [text] / ed. A.S. Bulatov. - M.: Jurist, 1999. - 896 p.
6. Dobrynin A.I. Economic theory[text] / edited by A.I. Dobrynina - St. Petersburg: "Peter", 2000 - 544 p.
7. Sazhina M.A. Economic theory [text] / M.A. Sazhina, G.G. Chibrikov. - M.: B Infra M, 2003 - 576 p.
8. Methodological provisions on statistics. M - Goskomstat of Russia, 1996
9. Russia in numbers. 2006 - M: State Statistics Committee of Russia, 2006
10. Zherebin V.M. The standard of living of the population [text] / Zherebin V.M., Romanov A.N. – M.: UNITI-DANA, 2002, - 592 p.
11. Polyak G.B. Finance, money circulation, credit [text] / ed. G.B. Polyaka - M .: UNITY-DANA, 2nd ed. 2003. - 512 p.
12. Romanovsky M.V. Finance: Textbook [text] / ed. prof. M.V. Romanovsky - M .: Yurayt-Izdat, 2006. - 462 p.
13. Vinokurov M.A. Labor Economics [text] / ed. Vinokurova M.A., Gorelova N.A. - St. Petersburg: Peter, 2004. - 656s.
14. Russia 98. Socio-demographic situation [text] - M.: ISEPN RAN, 1999
15. Socio-economic situation in Russia. [text] - M. Goskomstat, 2006
16. Social indicators of income and living standards of the population [text] / Ministry of Labor and Social Development of the Russian Federation. Issue. 7(93). M., 2001.
17. Ovcharova L.N. Income and Social Services: Inequality, Vulnerability, Poverty. Collective monograph. [text] / Manual. L.N. Ovcharov; Independent Institute for Social Policy. M.: GU-HSE, 2005.
18. Poduzov A.A. Measuring poverty ( overseas experience). [text] / Forecasting problems - 1996, No. 4
19. S. Kadomtseva. Social policy and population. [text] / The Economist - 2006, No. 7
20. T.Yu. Bogomolova, V.S. Tapilina. Poverty in modern Russia: scale and territorial differentiation. [text] / Eco - 2004, No. 11
21. Yu.S.Kusner, I.G.Tsarev. Dynamics of income distribution in Russia. [text] / Eco - 2006, No. 9
22. S. Belousova. Poverty analysis. [text] / The Economist - 2006, No. 10
23. V. Bobkov. The structure of society. [text] / The Economist - 2006, No. 7
24. S. Omelchenko. Deserted as ... in Russia? [text] / Economy and life - 2007, No. 8.
25. V. Sergachev. Unemployment lurks in the outskirts. [text] / Economy and life - 2007, No. 11
26. I. Sklyarov. How are you? For money! [text] / Economy and life - 2007, No. 6
27. Roik V. Income regulation mechanisms in Russia: results of inefficient use. [text] / Russian Economic Journal. - 2002, No. 8.
28. T. Glushanok. Integral criteria for assessing the standard of living of the population. [text] / Man and labor - 2006, No. 10
29. T. Efremenko. Live on a paycheck. [text] / Rossiyskaya Gazeta, No. 4354 of April 28, 2007
30. T. Efremenko. From paycheck to paycheck. [text] / Rossiyskaya Gazeta, No. 4289 dated February 8, 2007.
31. T. Shkel. Three boxes with money from the whole country. [text] / Rossiyskaya Gazeta, No. 4155 of August 28, 2006.
32. Message of the President of the Russian Federation to the Federal Assembly. [text] / Rossiyskaya Gazeta, No. 4353 of April 27, 2007.
33. Official website of the State Statistics Committee of the Russian Federation. [electronic resource] / www.gks.ru.
34. Official website of the Ministry of Finance of the Russian Federation. [electronic resource] / www.minfin.ru.
POLITICS AND ETHNOPOLICY
UDC 304.42 DOI: 10.22394/2079-1690-2017-1-4-128-132
MONEY INCOMES OF THE POPULATION AS A COMPONENT PART OF THE SOCIAL POLICY OF THE STATE
Alexander
Nikolaevich
Ponedelkov
Alexander
Vasilevich
Vorontsov
Alexeyevich
Goloborodko
Doctor of Philosophy, Professor, Russian Academy of National Economy and Public Administration under the President of the Russian Federation (119571, Russia, Moscow, Vernadsky Ave., 82). Email: [email protected]
Honored Scientist of the Russian Federation, Doctor of Political Sciences, Professor, Head of the Department of Political Science and Ethnopolitics, South Russian Institute of Management - a branch of the Russian Academy of National Economy and Public Administration under the President of the Russian Federation (344002, Russia, Rostov-on-Don, st. Pushkinskaya, 70/54], E-mail: [email protected]
Doctor of Law, Professor of the Department of Procedural
law, South-Russian Institute of Management - branch of the Russian
academy of national economy and public service
under the President of the Russian Federation (344002, Russia, Rostov-on-Don,
st. Pushkinskaya, 70/54]. Email: [email protected]
Doctor of Political Sciences, Associate Professor, Director,
Taganrog Institute named after A.P. Chekhov (branch] RGEU (RINH)
(347936, Russia, Taganrog, st. Initiative, 48).
Email: [email protected]
annotation
The dynamics of changes in the monetary income of the population after the May 2012 decree of the President of the Russian Federation is considered. The main elements of monetary income are analyzed - wages, social payments - pensions, allowances, scholarships, state social guarantees, their correlation with the subsistence minimum.
Key words: cash income, wages, pension, allowance, consumer basket, living wage, social guarantee, scholarship.
Monetary incomes of the population include salaries of employees, social payments - pensions, allowances, scholarships, insurance compensation and other payments, business income, income from property in the form of interest on deposits, securities, dividends, and other income. Real disposable money incomes are determined by dividing the nominal size index that has developed in a certain period of time by the consumer price index for the same time period. Disposable cash income includes cash income, from which mandatory payments and contributions are deducted.
The Decree of the President of the Russian Federation dated May 7, 2012 No. 597 “On Measures for the Implementation of the State Social Policy” provides for an increase in wages by 2018 as an integral part of the monetary income of the population. Therefore, let us consider the dynamics of changes in cash income, taking 2012 as a starting point. Per capita cash income increased from 23,221 rubles. in 2012 to 30,738 in 2016. Real disposable money income as a percentage of the previous year decreased from 105% to 94%. The average monthly nominal accrued wages of employees of organizations increased from 26,629 rubles. ($936] to RUB 36,746 ($549).
employees' wages as a percentage of the previous year decreased from 108% to 101%. The average size of assigned pensions increased from 9,041 to 12,391 rubles. The real size of assigned pensions as a percentage of the previous year became less: it was 105%, it became 97%. Disposable cash income is a guarantee of obtaining loans. Incl. number for social needs (education] .
An important indicator for assessing the level of cash income is the subsistence minimum - the cost estimate of the consumer basket, mandatory payments and fees, which is set per capita and for the three main socio-demographic groups - the working population, pensioners, children. The subsistence minimum in the country as a whole and in the regions is intended to assess the standard of living of the population in the development and implementation of social policy, federal and regional social programs; formation of the federal and regional budget; other purposes established by federal law. In the Russian Federation, it is necessary to justify the minimum wage established at the federal level, to determine the amounts of scholarships, allowances and other social payments established at the federal level. The subsistence minimum in the region is needed to provide the necessary state social assistance to poor citizens. The subsistence minimum is determined quarterly on the basis of the consumer basket and data from the federal executive body on statistics on the level of consumer prices for food products and consumer price indices for food products, non-food products and services, expenses on mandatory payments and fees. The subsistence minimum for a pensioner in the country for determining the size of the federal social supplement to a pension is established on the basis of the consumer basket and data from the federal executive body on statistics on the level of consumer prices for food annually by the federal law on the federal budget for the corresponding fiscal year and for the planning period. In the region, the subsistence minimum is established annually by a regional law. A family and a citizen living alone, if their average per capita income is below the regional subsistence level, are considered poor and have the right to receive social support.
The consumer basket is the minimum set of food products, non-food products and services necessary to maintain human health and ensure its vital activity, the cost of which is determined in relation to the cost of the minimum set of food products. The consumer basket is determined at least once every five years. In the regions, the consumer basket is established taking into account natural and climatic conditions, national traditions and local characteristics of the consumption of food products, non-food products and services by the main socio-demographic groups of the population. The consumer basket includes 11 types of food products, 50 percent ratios of the cost of non-food products and services with the cost of food products are established.
From 2012 to 2016, the average subsistence minimum per capita increased from 6,510 to 9,828 rubles. . As a percentage of the previous year, it became less: it was 102%, it became 101%. The amount of the subsistence minimum for a pensioner to establish a social supplement to a pension was increased from 5,564 to 8,803 rubles. The ratio with the subsistence level of average per capita cash incomes (357% and 313%), the average monthly nominal accrued wages of employees of organizations (378% and 347%), the average size of pensions (177% and 153%) has decreased. The population with cash incomes is lower the subsistence minimum increased from 15.4 million to 19.8 million, as a percentage of the total population - from 10.7% to 13.5%. rubles, including the able-bodied population - 11,163, pensioners - 8,506, children - 10,160. 20,819, Kamchatka Territory - 19,580, Voronezh Region - 8,581, Tatarstan - 8,568, Mordovia - 8,441.
An important component of the population's income is wages. The President of the Russian Federation instructed the Government to ensure wage increases by 2018. The Decree of the President provides:
Increase in real wages by 1.4 - 1.5 times;
Bringing the average salary of teachers and masters of industrial training educational institutions primary and secondary vocational education, employees of cultural institutions to the average wage in the region;
Raising the average salary of doctors, teachers of educational institutions of higher professional education and researchers up to 200% of the average salary in the region.
Increase in the average salary of social workers, including social workers of medical organizations, junior medical personnel (personnel providing conditions for the provision of medical services), paramedical (pharmaceutical] personnel (personnel providing conditions for the provision of medical services] - up to 100% of the average salary wages in the region, employees of medical organizations with a higher medical (pharmaceutical] or other higher education, providing medical services (providing the provision of medical services] - up to 200% of the average salary in the region.
In the first half of 2017, the average monthly accrued nominal salary of one employee in the organization amounted to 38,675 rubles. . Taking into account natural resources, geographical, industrial, economic, social and other factors, the gap in wages across regions is significant. Its largest size was in the Yamalo-Nenets (92,183 rubles), Chukotka (90,933), Nenets (75,013] Autonomous Okrug, Moscow (79,929), Magadan Region (70,627). the payment was in Kabardino-Balkaria (20,914), Dagestan (21,130), Altai Territory (21,750). The long-term problem of overdue wage arrears of employees of organizations remains unresolved. As of July 1, 2017, it amounted to 3 billion 207.7 million rubles , including in Primorsky Krai - 479.1 million, Khabarovsk - 130.7 million, Kemerovo region - 254.5 million In 10 regions there were no wage arrears. the number of unemployed, according to sample surveys of the labor force, amounted to 3 million 946.9 thousand people, 5.2% of the labor force registered with the public employment service - 815.7 thousand. For 2017, a minimum The minimum amount of unemployment benefits in the amount of 850 rubles. and the maximum value is 4.9 thousand.
The composition of the monetary income of the population by sources of formation includes income from entrepreneurial activities (in 2012 9.4%, 2015 - 7.9%), wages of employees, including social payments (40% and 38.3% ], social payments (18.3% and 18.2%], property income (5.1% and 6.2%), other cash receipts (27.1% and 29.3%]. . In the structure of social payments to the population, the share of pensions was 69.4% and 71.4%, respectively, benefits and social assistance - 26.4% and 24.5%, scholarships - 0.8% and 0.8%, insurance compensation - 3.4% and 3.3% In the structure of benefits paid, 1.8% and 1.5% accounted for unemployment benefits and material assistance, 7.7% and 8.1% - temporary disability benefits, 16.7% and 28. 1% - maternal and child benefits, 53.1% and 51.6% - cash payments to certain categories of citizens, 20.7% and 10.7% - other benefits and compensation.
The number of pensioners increased from 40 million 573 thousand to 42 million 729 thousand, the number of pensioners per 1000 people - from 283 to 291.6, the share of the number of working pensioners in the total number of pensioners - from 33.7% to 35 .7%. The average size of assigned pensions increased from 9,041 to 11,986 rubles. In 2016, the average old-age insurance pension, taking into account the fixed payment, was 13.1 thousand. In January 2017, all pensioners received a one-time cash payment in the amount of 5 thousand rubles. In 2017, the average annual insurance old-age pension will be 13,655 rubles. The ratio of the average size of assigned pensions to the subsistence level of a pensioner decreased from 176.5% to 150.5%, with the average amount of accrued wages increased from 33.9% to 35.2%. From January 1, 2018, pensions for non-working pensioners will be indexed by 3.7%, from April 1, social pension - by 4.1%, from February 1, monthly social payments - by 3.2%. There is no indexation of pensions for working pensioners. It is assumed that after the termination of employment, the pension will be indexed for the missed years.
The number of non-state pension funds from 134 to 102, the number of participants - from 6 million 781.5 thousand to 5 million 806.7 thousand. Number of recipients non-state pensions increased from 1 million 537.1 thousand people to 1 million 556.7 thousand. It was 3.8% of the total
the number of pensioners became 3.6%. Sum pension payments on average per month per recipient increased from 1,987 to 2,641 rubles.
The legislation establishes the main social guarantees - the minimum wage, allowances, scholarships, fixed payment to an insurance pension. The minimum wage increased from 4,611 to 6,852 rubles, as a percentage of the previous year - from 98.1% to 107.3%. . In relation to the subsistence minimum, it decreased from 67.5% to 59%. . Since July 1, 2017, it has been set in the amount of 7.8 thousand rubles. . In 2018, it will be increased to 9,489 rubles, which will be 85% of the subsistence minimum for the second quarter of 2017, from the beginning of 2019 it should be equal to 100% of the subsistence minimum for the working population. . In 2018, the cost of its increase will amount to 26.2 billion rubles in the public sector, 17.1 billion in business, and 43.9 billion and 28.8 billion in 2019, respectively. The increase will affect 4 million people, including 1.6 million public sector employees who have wages below the subsistence level of the able-bodied population.
The amounts of allowances and scholarships are small, with the exception of the state certificate for maternity (family) capital (453,026 rubles). early dates pregnancy, was equal to 581.7 rubles, the social allowance for burial - 5,277, the monthly allowance for a child of a serviceman undergoing military service on conscription - 10,528.2, a birth certificate - 11 thousand, a one-time allowance for the birth of a child and a one-time allowance for transferring a child to a family - 15,512.7 rubles each. A one-time allowance to the pregnant wife of a conscripted military serviceman was paid in the amount of 24,565.9 rubles. The ratio with the subsistence level of the monthly allowance for the period of leave to care for a child until he reaches the age of one and a half years for caring for the first child was 30.1% (2,908.6 rubles), for the second and subsequent children - 60.1% (5 817.2], the amount of state academic scholarships for students studying educational programs higher education - 12.7% (1,340), secondary vocational education - 4.6% (487). .6% of the subsistence level], disability of group III and on the occasion of the loss of a breadwinner - 2,191.8 (27.3%).
There is a significant differentiation in the monetary incomes of the population. The significant stratification of the population in terms of monetary income is evidenced by such indicators as the distribution of their total volume among various groups of the population, the coefficient of funds (income differentiation coefficient), the Gini coefficient (income concentration index]. The distribution of the total volume of monetary income by various population groups shows the share of the total cash income in each of the 20 percent groups of the population, ranked in order of increasing per capita cash income.The first group with the lowest income had 5.2% and 5.3% of cash income, respectively, the fifth group highest income- 47.6% and 47.1%. The coefficient of funds (income differentiation coefficient] characterizes the degree of social stratification. It is defined as the ratio between the average levels of monetary incomes of 10% of the population with the highest incomes and 10% of the population with the lowest incomes. The coefficient of funds decreased from 16.4 to 15.7 times. The Gini coefficient (income concentration index] characterizes the degree of deviation of the line of actual distribution of the total income of the population from the line of their uniform distribution. The value of the coefficient can vary from 0 to 1. The higher the value of the indicator, the more unevenly distributed incomes in society. The Gini coefficient decreased from 0.420 up to 0.414.
There have been minor changes in the structure of monetary incomes of the population. Income from entrepreneurial activity decreased from 9.4% in 2012 to 7.8% in 2016, wages - from 65.1% to 64.7%. The share of social payments increased from 18.4% to 19.2%, property income - from 5.1% to 6.3%. Other incomes remained at the same level (2%].
There are significant differences in the monetary incomes of the population in metropolitan areas, cities and towns. countryside. In May 2017, the Institute of Sociology of the Federal Research Sociological Center of the Russian Academy of Sciences, in cooperation with the Moscow office of the F. Ebert Foundation, conducted a survey on a representative all-Russian sample of two thousand respondents living in megacities, urban and rural settlements. . The survey showed that the monthly income per household member was 18,360 rubles, in Moscow and St. Petersburg - 34,976, in cities - 17,341, in rural areas - 13,818.
respectively, 8.3%, 12.1% and 10.9% of the respondents noted their financial situation, deterioration - 41.1%, 35.2% and 32.4%.
Summing up, it should be noted that the analysis of statistical data on the income of the population shows that income policy has not yet become a priority area of state social policy. Similarly, social policy should be considered as one of the main priorities of the state.
Literature
1. Ignatova T.V., Mushenko I.G. public finance in the public sector regulation system. - Rostov n/a: SKAGS Publishing House, 2004.
2. Russia in numbers. 2017. Statistical collection // http://www.gks.ru.
3. Ignatova T.V., Filimontseva E.M. Educational loans as investments in the professional and labor potential of the population // FES: finance, economics, strategy. 2016. No. 7. S. 29-33.
4. Federal Law of December 3, 2012 No. 227-FZ “On the consumer basket as a whole in the Russian Federation” // Collected Legislation of the Russian Federation. 2012, No. 50 (Part IV), p. 6950.
5. Decree of the Government of the Russian Federation of September 19, 2017 No. 1119 “On the establishment of the subsistence minimum per capita and for the main socio-demographic groups of the population as a whole in the Russian Federation for the II quarter of 2017 // Rossiyskaya Gazeta. 2017. September 25.
6. Main indicators of the socio-economic situation of the constituent entities of the Russian Federation in the first half of 2017 // Rossiyskaya Gazeta. 2017. September 13.
7. Decree of the Government of the Russian Federation of December 8, 2016 No. 1326 “On the size of the minimum and maximum unemployment benefits for 2017” // Collected Legislation of the Russian Federation. 2016, no. 51, art. 7378.
8. Monetary incomes and expenses of the population in 2011-2015 Statistical bulletin. 2017 // http://www.gks.ru.
9. Russian statistical yearbook. 2016 // http://www.gks.ru.
12. Federal Law of June 19, 2000 No. 82-FZ “On the Minimum Wage” // Collection of Legislation of the Russian Federation, 2000, No. 26, Art. 2729; 2016, No. 52 (Part V), Art. 7509.
Averin Aleksandr Nikolaevich, Doctor of Philosophical Sciences, Professor, Russian Presidential Academy of National Economy and Public Administration (82, etc. Vernadsky, Moscow, 119571, Russian Federation). Email: [email protected]
Ponedelkov Alexandr Vasilievich, Doctor of Political Science, Professor, Head of Cathedra of Politology and Ethnopolitics; South-Russia Institute of Management - branch of Russian Presidential Academy of National Economy and Public Administration. (70/54, Pushkinskaya St., Rostov-on-Don, 344002, Russian Federation). Email: [email protected]
Vorontsov Sergey Alexeevich, Doctor of Legal Science, Professor, Professor of Cathedra of Process Law; South-Russia Institute of Management - branch of Russian Presidential Academy of National Economy and Public Administration. (70/54, Pushkinskaya St., Rostov-on-Don, 344002, Russian Federation). Email: [email protected]
Goloborodko Andrey Yuryevich, Doctor of Political Science, associate professor, director, Taganrog Institute of A.P. Chekhov (branch) of RGEU (RINH) (48, Initsiativnaya St., Taganrog, 347936, Russian Federation). Email: [email protected]
MONEY INCOMES OF THE POPULATION AS AN INTEGRAL PART OF STATE SOCIAL POLICY
Discusses the dynamics of money incomes of population since the May 2012 year of the Decree of the President of the Russian Federation. It analyzes the main elements of the cash income-wages, social benefits-pensions, benefits, scholarships, State social guarantees, their relationship to the cost of living. Keywords: monetary income, wages, pensions, benefits, consumer basket, social guarantee a scholarship.
To the group key indicators the standard of living and the level of well-being are indicators that reflect the level and dynamics of the income of the population. And the indicator of real disposable income of the population is also considered as one of the key macroeconomic indicators. First of all, this is due to the fact that the incomes of the population (households), regardless of their form and source of receipt, are the main source of the formation of funds necessary to meet the current (current consumption) and deferred needs (savings) of people. Thus, the incomes of the population, their dynamics most directly affect the standard of living of the citizens of the country, the possibilities of human development.
Secondly, the level of income of the population, its dynamics are considered as one of the most important parameters that determine the dynamics of aggregate demand, and, consequently, the dynamics of economic growth in the country.
Inequality of personal income in a market economy is natural and inevitable. Moreover, the opportunity to have high incomes is seen as a significant stimulating factor that encourages people to get a good education, improve their skills, and take their job duties more responsibly. Low incomes at the macro level may indicate the inefficiency of economic and social policy, and at the corporate level - the inefficiency of production and management, the low level of social responsibility of the employer.
From the point of view of market ideology, all incomes, regardless of their level, are considered fair - however, on one condition: if they are obtained as a result of fair, conscientious competition, while observing ethical standards and principles of social responsibility. At the same time, it is obvious that excessive differentiation of the incomes of the population can lead to undesirable social consequences: social insecurity and instability, a decrease in the level of trust and degradation of social capital in society, social conflicts and growth costs of disorder
As mentioned in the previous sections, the growing differentiation of incomes of the population and, as a result, the deepening of social inequality are considered, on the one hand, as one of the trends in the transformation of the social structure of modern society, and on the other hand, as one of the most acute global social challenges and risks.
Important to remember
The regulation and policy of incomes are considered as one of the most important social functions of the state and directions of the state social policy.
formed secondary income, primarily transfers - gratuitous payments from the budget and (or) special funds that are not related to the ownership of factors of production (pensions, scholarships, child benefits, unemployment, etc.).
The distribution of national income among the owners of factors of production is called functional distribution income. Personal (vertical) the distribution of income occurs between individuals (households) regardless of the source of income.
By form of receipt It is customary to distinguish between monetary and non-monetary (in kind) income.
AT monetary form, business entities receive factor income (wages, interest, rent payments, profits) and transfers (stipends, pensions, various benefits). In the modern economy, people receive mainly cash income. Income in natural form- these are products grown on a personal subsidiary farm, items independently made for personal consumption.
The amount of money received by people for a certain period (week, month, etc.) is their nominal income. Real income - the cost of a certain set of goods that can be purchased over the same period, its value depends on the size of nominal income and the price level.
By degree of legality distinguish legal(legally obtained) and illegal(shadow) income. The latter, in turn, can be divided into income from unrecorded economic activities and income of criminal origin.
In accordance with life cycle distinguish between income received before the start of labor activity (benefits, scholarships), from participation in labor activity (salary), received by temporarily unemployed citizens (unemployment benefits), after completion of labor activity (pension).
According to the ILO, since the 1980s In most developed countries, there is a trend towards a reduction in the share of labor income in national income and an increase in the share of return on capital. According to experts, this trend undermines the pace and sustainability of future economic growth, as it limits the possibilities for growth in household consumption, workers have a feeling of unfair income, which can lead to undesirable socio-political consequences .
The volume and structure of monetary incomes of the population of Russia. The data of the State Statistics Committee of Russia on the structure and volume of incomes of the population in Russia are given in Table. 6.1.
Table 6.1
The volume and structure of monetary incomes of the population by sources of income
|
Total cash income, billion rubles |
Including in % |
|||||
|
wages, including hidden wages |
business income |
social |
property income |
|||
Source: Data Federal Service state statistics. URL: http://www.gks.ru/wps/wcm/connect/rosstat_main/rosstat/ru/statistics/population/level/# (Accessed 08/10/2015).
As can be seen from the above data, the income structure of the population in our country is quite stable. The main source of income continues to be wages, which generally corresponds to the situation in other countries. Noteworthy is the relatively high share of social payments, which in 2013 amounted to more than 18%. However, in order to ensure social sustainability and a decent standard of living, it is important that the income structure is more diversified, and that people's well-being does not depend on a single source of income.
It was noted above that in Russia the level of income differentiation is excessive (according to 2013 data, the decile coefficient is 16.3, the Gini coefficient (index) is 0.419). The trend of deepening inequality in the incomes of the country's population has not yet been reversed.
Among the causes (factors) of income differentiation, it is customary to distinguish between economic, geographical, demographic, social, and personal factors.
Economic factors - the presence (absence) of property, the amount of controlled capital, the type and scope of activity, the form of ownership of the organization, the position of a particular company in the market, its financial stability (instability).
Geographic factors - features of natural and climatic conditions (unfavorable living and working conditions imply compensation payments).
Demographic factors - gender, age, ethnic and other types of discrimination in the labor market.
Social factors - belonging to a particular social group. Social status and social ties largely determine a person's choice of a search model for a field of activity that will bring him income.
Personal factors - the level of development of human abilities, the possibility of their development and use, individual psychological characteristics; level of education and qualifications, health status.
In general, the incomes of the population are formed as a result of the action in the first place economic factors different levels: macro level(macroeconomic situation in the country), meso level (situation in the region or industry), macro level(state of health, level of development of abilities, education and qualifications, place and form of employment). The amount of income received by households depends on the ratio of supply and demand in the resource markets, the marginal productivity of resources, the influence of non-economic factors (for example, personal inclinations of people to work or idle, the quality of the social environment, etc.). So, key factor, which determines the level of wages, is labor productivity, which is directly related to the employee's human capital - his knowledge and skills obtained in the process of general and vocational education and work. At the same time, the level of education or labor productivity alone is not enough to explain the fluctuations in wages in different countries or within one country.
A high degree of income differentiation gives rise to serious socio-economic problems: the middle class is disappearing, followed by an inevitable change in the structure and level of demand; society bears the social costs associated with poverty and poverty as extreme forms of income differentiation; social tension and political instability are intensifying and becoming a brake on economic development.
In order to correctly correct the prevailing income inequality within the framework of income policy, it is necessary to have information about the level of their differentiation (degree of inequality). Various indicators are used to measure income and the level of their differentiation.
Income differentiation coefficients(funds ratio, decile, quarterly and quintile coefficients) show how big the income gap is between the most and least well-off groups of the population, which have the same share in its total number.
At present, the value of the coefficient of funds in the Scandinavian countries is about 4, in Russia - about 16, in Singapore - more than 20; the world average is about 10 (this value of the coefficient is considered critical).
A graphical interpretation of the level of income differentiation was proposed by M. Lorenz. shows the cumulative distribution of the population and the corresponding incomes. The data for constructing the Lorentz curve for Russia are given in Table. 6.2.
Table 6.2
Distribution of the total volume of cash income of the population
|
Cash |
Including for 20% population groups, % |
|||||
|
first (lowest income) |
fourth |
fifth (with the highest income) |
||||
Source". Rosstat data. URL: http://v
www.gks.ru/wps/wcm/connect/rosstat_
main/rosstat/ru/statistics/population/lcvcl/ (Accessed 09/10/2015).
To build the Lorenz curve (Figure 6.1), 20% shares of the population and cash income are plotted along the axes and graphs are plotted for hypothetical cases: absolutely uniform (OA) and absolutely uneven (BOTH) income distribution. Graphs illustrating the actual distributions of income will be located between them. Based on the position of the graph in the coordinate system, one can make reliable assumptions about the degree of inequality: the closer the graph is to the OA curve, the more uniform the distribution of income it corresponds to. Figure 6.1 also shows curves showing the actual distribution of incomes of the Russian population in 1970 and 2013. The deviation of the Lorentz curve from the line of absolute equality is measured through the ratio of the area of the segment formed by the Lorentz curve and the OA line to the area of the triangle formed by the lines of absolute equality and inequality. This indicator is called the Gini coefficient (index), or wealth concentration coefficient.

Rice. 6.1.
Coefficient (index) Gini(G) characterizes the differentiation of monetary incomes of the population in the form of the degree of deviation of the actual distribution of incomes from their absolutely equal distribution among the inhabitants of the country. Coefficient values range from 0 (absolute equality) to 1 (absolute inequality). An example of the dynamics of the Gini coefficient in the countries of the world is shown in fig. 6.2. Its typical value for developed countries is from 0.2 (in the Scandinavian countries) to 0.35 (in the USA), for developing countries it is OD-OD and coincides with the Russian indicator.

Rice. 6.2.
Russia;.....China;.........India;-Brazil
Source-. World Bank Data, 2012.
In a hypothetical unregulated market economy (in the absence of a state that smooths out income differences), the distribution of income would be extremely uneven, which is unacceptable for a modern civilized society. To maintain stability, the state is forced to take on the functions of organizing a decent life for people, which in the historical past were performed by the family or community and which, by definition, the market cannot fulfill. In theory and in practice, such a redistribution of social responsibility took shape in the form welfare state concepts (welfare state). This concept was formed in the 1930s-1940s. based on the ideas of famous economists D. Keynes, A. Pigou and sociologists A. Muller-Armak, G. Esping-Andersen. The purpose of its implementation in practice is to create conditions for achieving the highest possible standard of living in a given society. The socially oriented activity of the state is considered as a means of achieving the goal, which involves the regulation of the labor market and income, the fight against unemployment, the selective support of industries, the implementation of social programs (development of education, healthcare, various social payments to the population, etc.).
One of the most important activities modern state is the regulation of income, carried out through the implementation public policy income . Income policy is an integral element of the state's social policy.
It should be noted that the income policy can be based on the principle of "non-intervention" of the state in the process of their regulation. At the same time, the practice of economically developed countries of the world indicates that the state regulates income using certain methods and tools. As main goal income policy considers the adjustment of the consequences of the functioning of the market mechanism of management, reducing the level of income differentiation, material and social inequality, the implementation of measures aimed at increasing incomes and equalizing them.
Important to remember
Income policy is one of the most important areas of the state's social policy; a system of measures aimed at increasing incomes and equalizing them, reducing the level of differentiation of incomes of the population.
To main directions revenue policy should include:
- - reducing excessive inequality in wages and other types of income of the population;
- - reduction in the number of low-skilled and low-paid categories of workers; promoting the creation of jobs requiring high qualifications;
- - counteraction to inflationary depreciation of incomes and savings of the population; indexation of cash income and savings;
- - maintaining the correlation between wages and labor productivity;
- - determination and maintenance of the minimum acceptable parameters of the life of the population (setting the minimum wage, pensions and social benefits);
- - regulation of wages for public sector employees, etc.
The state, by correcting the process of income distribution, realizing the redistribution of incomes of the population, creates conditions for raising the level and quality of life, and contributes to the easing of social tension. Subjects government revenue policy are the authorities different levels. Object - income population (primarily cash) received from various sources, as well as factors, influencing the level of incomes of the population and their dynamics. The degree of state intervention in the distribution and redistribution of income is determined by the level of income differentiation of the population, the perception of social inequality by society, the ideas of social justice accepted in this society, the features and priorities of the state's social policy.
The process of income regulation involves the use of a wide range of methods and tools: administrative, legal, economic (direct and indirect).
Methods administrative regulation- various methods of licensing, quotas, rationing of activities, as well as methods of regulating prices, incomes, exchange rate. Their distinctive features are the establishment of strict regulations for the economic entity, strict regulation of its actions through various kinds of resolutions, decrees and decisions.
An example of administrative methods of income regulation is the freezing of wages or the establishment of minimum and maximum limits for the decrease / increase in income. Such measures, as a rule, are applied by the state in relation to civil servants, employees of budgetary organizations and institutions, state-owned companies (for example, limiting the size of bonuses for non-goyim managers).
Legal regulation income is carried out through legal norms enshrined in law, and involves the development of legal and regulatory framework for the state policy of income, following international norms and standards in the field of their regulation.
International norms and requirements are enshrined in such documents as the Universal Declaration of Human Rights, ILO Convention No. 117 "On the Fundamental Objectives and Norms of Social Policy", ILO Convention No. 131 and ILO Recommendation No. 135 "On the Establishment of Minimum Wages with Particular Consideration for Developing Countries", ILO Convention No. 95 “On the protection of wages”, etc.
According to the Constitution of the Russian Federation (Article 15, and 4), the generally recognized principles and norms of international law and international treaties of the Russian Federation are an integral part of its legal system, and international treaties signed and ratified by Russia take precedence over domestic legislative acts.
As an example Russian laws significant in the context of the problem under consideration, the Labor Code of the Russian Federation, federal laws № 134-FZ of September 24, 1997 "On the subsistence minimum in the Russian Federation" (as amended on December 03, 2012), No. 22-FZ of June 19, 2000 "On the minimum wage", No. 166-FZ of January 15 2001 “On State Pension Provision in the Russian Federation” (as amended on July 21, 2014).
Economic regulation involves the use of methods of direct and indirect economic regulation.
Methods direct economic regulation force a business entity to make decisions based not on its own economic choice, but on the basis of state prescriptions. Basic tools - government order, target financing (budgetary, in the form of subsidies, subsidies), national programs and projects, public investments. Among the methods of direct economic regulation, we should mention the regulation of wages (determining the types, size and mechanism of accrual) of employees in the public sector; social state transfers; social guarantees (definition of the subsistence minimum, minimum wage).
Methods indirect economic regulation does not imply direct state intervention in the decision-making process by business entities, they are aimed at creating conditions under which an independent economic choice of a business entity would be consistent with the goals of the state's economic policy. The most important instrument of indirect economic regulation of incomes of the population is state tax policy. Through tax policy it is possible to redistribute income, reduce inequality, encourage companies to become more socially responsible in terms of complying with established wage standards, and encourage them to provide jobs to people with disabilities.
The redistribution of income is rightly referred to as the most important functions of taxes. The introduction of a system of progressive taxation in the country (increase effective rate tax with the growth of the taxable base) reduces the degree of income inequality. For example, in Sweden the maximum tax rate income tax is almost 60%, and in Russia - 13% (it is interesting to compare these data with the value of the Gini coefficient - see Fig. 6.7).
Another revenue management tool that has proven to be effective is tax incentives provided to socially vulnerable categories of the population and allowing to reduce the tax burden on their income. The main category of recipients of social benefits are pensioners; benefits are also addressed to the disabled, labor veterans, large families, combat veterans; poor and other socially unprotected categories of citizens. Preferential categories citizens may be granted income tax deductions, property or land tax may be assessed at preferential rates.
Along with these methods of regulation are widely used conciliation methods: coordinating the actions of the government, entrepreneurs and employees on wages and social transfers within the framework of social partnership.
The implementation of an effective revenue policy can be hampered by a number of factors, among which are the following.
- 1. Resource opportunities of the state. They are determined by state (budgetary and extrabudgetary) expenditures, the budgetary policy of the state, and the balance of the country's budget. Social expenditures of the state, including those allocated for wage increases, income indexation, social transfers, must correspond to its financial capabilities. Excessive (compared to opportunities) social spending can cause a budget deficit and cause inflation and a decrease in real incomes of the population.
- 2. Reduced incentives for economic activity. Redistribution of income through progressive system taxation can lead to a decrease in business activity in the country, since it reduces the investment opportunities of companies and, accordingly, incentives to expand economic activity. In addition, an effect known as the Okep's Bucket is likely to occur: a dollar taken from the rich is given to the poor in a "leaky bucket", as a result, only a part of the redistributed income reaches the poor, and redistribution in the name of equality harms economic efficiency.
- 3. Negative impact on the labor market. Social payments can distort the labor market. Unemployment benefits that are too high encourage recipients to stop looking for work. The consequence will be a reduction in tax revenues to the budget, the degradation of accumulated human capital, a violation of labor motivation, an increase in consumption at the expense of savings, with obvious macroeconomic consequences.
- 4. Danger of bureaucracy. The redistribution of income presupposes the functioning of certain bureaucratic structures with their own interests, which do not always coincide with the interests of the state, the desire for self-reproduction and economic power.
The above factors make it more or less difficult to implement an effective revenue policy in any country in the world. At the same time, its absence is dangerous in terms of its consequences (the growth factor of poverty, the material and social inequality of citizens, social tension, the formation of social contradictions and risks.
- Report "Wages in the world in 2012-2013". Wages and Equitable Growth / GTPAG and ILO Office for Eastern Europe and Central Asia. M. : MOT, 2013. C. V-VI. URL: http://www.trudcontrol.ru/files/editor/files/Global_wages_ru.pdf (Accessed 09/10/2015). The Gini coefficient is calculated to determine the differentiation of monetary income and the wealth of the population - in the second case, the distribution of assets is taken into account. 13th in the world. Convention No. 117, when calculating the subsistence minimum, takes into account the basic needs of working families (food, their calorie content, housing, medical care, education, etc.).
- Arthur Oken (1928-1980) - American economist, adviser to the President of the United States. Kennedy.