1.5 Basic macro economic indicators and methods of their measurements.
The SNA is a system of macroeconomic indicators that reflect the most important and general aspects economic development in their interconnection and interaction. The main indicators of national accounts are: gross national product(GNP), gross domestic product (GDP), net national product (NNP), national income(ND), personal income (LD).
All the most important indicators used in macroeconomic analysis are fundamentally divided into three groups: flows, stocks (assets) and indicators of economic conjuncture. Flows reflect the transfer of values by subjects to each other in the process economic activity, reserves - the accumulation and use of values by subjects. Flows are economic parameters, the value of which is measured per unit of time, usually per year, the value of the economic parameters of stocks is measured at a certain moment. An example of flows is savings and investment, a budget deficit, stocks are the resulting capital, public debt.
Gross output is the value of all goods and services produced in an economy over a given period of time. Gross output includes absolutely all goods produced in the economy, including those intended for the production of other goods and services, the latter constitute intermediate consumption.
Gross national product (GNP) - is the total market value of all goods and services intended for final consumption and produced with the help of factors owned by a given country during a certain period of time (usually a year). GNP, in contrast to gross output, is cleared of intermediate consumption.
In this definition, attention should be paid to the key phrases: "market value", "final consumption", "factors belonging to a given country". They concentrate the basic principles used in calculating GNP. Thus, the concept of "market value" means that the valuation of goods and services included in GNP is carried out at market prices. Market price includes indirect taxes(excises, VAT, sales taxes, etc.). It differs from those factor prices that sellers of goods receive. The market price minus indirect taxes equals the factor cost. GNP includes goods and services at market prices. When calculating GNP, only final consumption is taken into account, that is, only the cost of final products. End products are goods and services that are purchased for end use and not for resale or further processing. When calculating GNP, it measures only the value of output produced by factors of production owned by a given country. For example, income received by a Moldovan citizen working in Greece is included in the GNP of Greece, but not included in the GNP of Moldova, since it is not received on its territory. At the same time, this income is included in Greece's GDP.
Describing GNP as "the most accurate total measure of goods and services that a country can produce" (P. Samuelson), Western economic thought has developed three methods for measuring it: by spending on products created in the country, by income received as a result of production, and as well as the value added method. The first method is the cost method. The value of GNP is defined as the monetary value of final products and services produced in a year. In other words, it is necessary to sum up all the costs for the acquisition (consumption) of the final product. The GNP indicator includes: consumer incomes of the population; (C); Gross private investment in the national economy; (Ig); Government procurement of goods and services. (G); Net exports (Xn); which represents the difference between the country's exports and imports. Thus, the costs listed here are GNP and show the market value of annual production:
C + Ig + G + Xn = GNP
The second method is the method of calculating GNP by income. GNP, on the other hand, is the sum of income individuals and enterprises ( wage, interest, profit) and is defined in general as the sum of the remuneration of the owners of factors of production. This figure also includes indirect taxes on businesses, depreciation, property income. GNP can also be defined as the sum of incomes of sectors of the national economy. Both methods are considered equivalent and give the same GNP result. To eliminate double counting, the value added indicator, which is the difference between firms' sales of their finished products and purchasing materials, tools, fuels and services from other firms. Value added is the market price of a firm's output minus the cost of raw materials consumed and materials purchased from suppliers. Summing up the value added produced by all economic entities, it is possible to determine the GNP, which represents market valuation all produced goods and services.
The gross national product is calculated at current market prices, which represents its nominal value. To obtain the true value of this indicator, it is necessary to clean prices from the influence of inflation, apply a price index, which will give the real value of the gross national product. Attitude nominal GNP to real GNP shows the increase in GNP due to price increases and is called the GNP deflator.
Gross domestic product (GDP) is the monetary value of all final goods and services produced in an economy over a given period. This takes into account the annual volume of final goods and services created by economic units that are residents of a given country. That is, enterprises, financial institutions, authorities government controlled and private non-profit organizations serving households, etc., the center economic interests which is associated with the economic territory of a given country for a year or more. Gross domestic product is obtained by subtracting net exports from the total GNP:
GDP=GNP-NE
Net export is the difference between the value of exporting goods and services and the value of importing products from abroad. The difference between GNP and GDP is insignificant; it ranges from - 1% to 1.5% of GDP. Based on the GNP and GDP indicators, a number of other important macroeconomic indicators included in the system of national accounts (SNA) can be calculated. One of them -
Net national product or NNP. It is defined in the following way:
NNP = GNP - Depreciation
It is known that buildings, equipment, machines, which are one of the main elements of production, serve for several years. Therefore, each unit of goods will contain a part of their cost. The state legislates the service life of such assets, and thereby determines what part of their value will be monthly and daily contained in the produced mass of commodities. Thus, in the proceeds received from the sale will be contained in monetary form and the consumed (transferred) part of the cost of equipment and machinery. Every year this part is withdrawn, accumulated and, when the service life of the equipment ends, it is used to purchase a new one. The considered mechanism for the renewal of consumed factors of production is called Depreciation. Obviously, in order to find out the true volume of final products that can be used to improve the welfare of the population, depreciation must be subtracted from GNP, i.e. that part of the cost that goes to the renewal of worn-out factors of production. The rest of the GNP is called the net national product. Next indicator –
National Income (ND):
ND = NNP - indirect taxes on entrepreneurs.
Indirect taxes act in this case as a macroeconomic regulator between the prices at which consumers buy goods and the sales prices that are set by firms. National income is the total income earned by the owners of the factors of production: owners of labor (wages of wage workers), owners of capital (profit and interest), owners of land (land rent). To determine the ND from the NNP, it is necessary to subtract indirect taxes; the latter are markups on the prices of goods and services (excises, VAT, duties, etc.). The meaning of this lies in the fact that the state, by levying taxes, does not invest anything in production, therefore it cannot be considered as a supplier economic resources. From the point of view of resource owners, ND is a measure of their income from participation in production for the current period. In Russian practice, a breakdown into two funds is used:
the consumption fund is a part of the ND that ensures the satisfaction of the material and cultural needs of people and the needs of society as a whole (for education, defense, etc.);
the accumulation fund is a part of the ND that ensures the development of production.
The SNA usually defines the rate of accumulation and the share of consumption, but as a percentage of GDP, not of national income. After making certain adjustments to the ND, such as social security contributions, income tax, undistributed income of corporations, transfer payments (pensions, child support, disability, unemployment, government subsidies, etc.), another macroeconomic indicator arises - personal income.
Disposable income (DI) or personal disposable income. Represents income received by households, other than NI, which is earned income. It should be noted here that part of the income earned is contributions to social insurance, taxes on profits of enterprises - is not available to the population. At the same time, transfer payments made by the state are not the result of economic activity employee, but represent part of their income. Disposable income as income actually received can be calculated by subtracting social security contributions, corporate income taxes, retained earnings, individual taxes(income, taxes on personal property, inheritance) and adding the amount of all transfer payments. Disposable income is at the personal disposal of members of society and is used for household consumption and savings. Personal income:
Personal Income (PI) = NI - Social Security Contributions - Corporate Retained Earnings + Income Taxes + Transfer Payments + Personal Interest Income, such as interest on the public debt.
For the economy as a whole, national disposable income or national disposable product is also defined, which can be defined as follows:
NSD = GNP ± net transfers from abroad (i.e. gifts, donations, humanitarian aid, etc.).
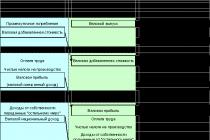
So, the relationship of macroeconomic indicators can be represented by the following scheme:
Gross Domestic Product (GDP) - Depreciation (A) =
Net domestic product (NDP) - Indirect taxes =
National Income (NI) - Corporate Income Taxes - Social Security Contributions - Individual income taxes– retained earnings of enterprises + transfer payments = Disposable income (DI).
Analysis sectoral structure economy is based on GDP calculated by industry. First of all, the ratio between the major economic sectors of the material and non-material is taken into account. material production.
The considered macroeconomic indicators are calculated on the basis of GNP and are closely interconnected, characterizing various aspects of the country's economic life. Macroeconomic indicators act as a way of displaying the state of affairs in the national economy in reporting. There are the most general (GNP, GDP) and more specific forms of indicators of macroeconomic activity. There are absolute and relative indicators, among which macroeconomic indices are of great importance. The main flows in the SNA are valued at market prices, that is, at the prices at which transactions are made (producer and end-customer prices). GDP is estimated at end-customer prices, gross output - at producer prices.
Products and services that do not take a commodity-money form are valued at market prices for similar goods that are sold on the market, or at cost if there is no market price (services public institutions, public organizations etc.). The SNA makes it possible to create an information base for studying the real processes that take place in a market economy, such as the development of production, inflation, unemployment, privatization, tax and customs activities. Below (see annex) is a diagram of the System of National Accounts.
Chapter 2. Modern problems of the formation of the Russian SNA
The use of the SNA is necessary for effective macro economic policy state, economic forecasting, for international comparisons of national income. The process of transition to a market model of management and building a civilized market society is a complex and lengthy process, inextricably linked with the problems of various kinds and in almost all spheres of society. I will consider only the scope economic relations.
The first step towards achieving the goal (the formation of the Russian SNA under market economic methods) should be the development of conceptual, theoretical, methodological and statistical aspects of the structure of the new macro-model of the economy, institutional, sectoral and sectoral groupings of the national economy. In general, the main problems of the formation of the SNA in Russia can be reduced to the following:
1. Conceptual (development of the main provisions and principles for the formation of the Russian analogue of the version of the UN SNA 1993;
interpretation of production activity and definition of its boundaries;
determination of the cost composition of the product; development of the structure of the state budget, etc.);
2 Theoretical (strict scientific substantiation of the formation of a system of basic macroeconomic indicators in market conditions and the correspondence of the mechanism of their functioning to the economic structure of the economy);
3. Institutional (classification of institutional units according to the functional principle);
4. Methodological (the formation of a modern market forecasting methodology based on the principles of equivalence and interdependence of economics and politics, when the calculation of forecast indicators is based on data from regulatory legal acts that meets the needs of the Russian specifics of managing statistical accounting and forecasting bodies, public authorities, as well as international requirements and standards; creation on this basis of a balance method for describing the economy, adequate to the market economic model of Russia; development of methodological approaches to the formation of the structure of reporting indicators of the socio-economic development of the national economy: production, consumption (intermediate and final), distribution and redistribution of income, foreign trade; interpretation financial flows; classification of income and expenses; definition of the category of savings and others);
5. Organizational and legal (approval of property rights and distribution of the boundaries of their specific structure; creation of an integrated reporting system based on the State Statistics Committee of Russia, formed on the basis of the mandatory submission of reporting data by the Central Bank of Russia, the Ministry of Finance, the Customs Committee and other services and departments that are holders of financial reporting information and non-financial nature of enterprises and organizations, characterizing the development of the national economy of the country as a whole and within the framework of the monetary sector, the sector of government bodies and the external sector of the economy);
6. Statistical (updating the unified state register of enterprises and organizations of the State Statistics Committee of Russia (EGRPO); reviewing the procedure and methods for collecting external and internal sources data, their generalization and development of new data sources using new methods that meet the requirement of building a system of national balances).
All these problems are interrelated, since, for example,
changing the concept of development of the national economy involves changing the socio-economic organization of society, the mechanism of functioning of the economic system itself, and so on.
And now we can move on to a more detailed consideration of these problems.
Conceptual problems. The conceptual problems of the formation of the SNA in a market economy are reduced to:
1. Determining the boundaries of production activities in the conditions of a market business model;
2. Development of the main conceptual provisions for the further development of the national economy and, in accordance with this, determining the composition of the system of basic indicators of the socio-economic development of the national economy;
3. Development of the basic principles for the formation of the Russian system of national balances (integrity and balance in the context of the institutional sectors of the economy as a whole for the economy as a whole for the economy; the validity of the calculation of macroeconomic indicators due to the relationship of indicators and instruments and parameters of the state socio-economic policy in the context of all its directions );
4. Development of the basic principles for the functioning of the Russian system of national balances;
5. Determining the main directions for the development of the SNA in accordance with the established option for the development of the national economy in the future;
6. Development of the basic principles for the formation of scenario conditions for the forecast;
7. Development of the basic principles for the formation of a system of macroeconomic indicators in the reporting and forecast periods, operating on the basis of tools and parameters of various areas of state socio-economic policy;
8. Development of basic principles for the formation of short-term, medium-term and long-term forecasts using various areas of state socio-economic policy, their tools and parameters;
9. Compliance with the conceptual provisions of forcing Russian system national accounts to the main concepts of the 1993 UN SNA. in its general form, international requirements and standards.
Theoretical Problems The theoretical basis of the Russian SNA should be a system of views characteristic of the future market economy of Russia. Built on the principles of theoretical concepts of the formation of the Russian SNA; the mechanism of its functioning and determination of the boundaries of action. Almost all capitalist states have national accounts, but no country has a system in its pure form. The reason lies in the very nature of the capitalist economy, in which government bodies do not have full access to economic information private enterprises. Therefore, the SNA of the capitalist countries is limited to the study of economic equilibrium, the process of income formation and the conditions for the sale of the product. In this connection, at present, the main content of the national accounts in the capitalist countries (France, the USA, England) is income flows. Other aspects of economic analysis, such as the consideration of the production process and the interbranch production relations arising from it, or the financial turnover corresponding to the movement of income, or the determination of the wealth of a nation and its influence on economic life, are somewhat isolated. However, despite the fact that until now in the capitalist countries there is no fully integrated system of economic accounting that would bring together all aspects of analysis and forecasting, national accounting is developing approximately in this direction. In Russia, in accordance with the established practice of statistical accounting and forecasting, based on the concept of K. Marx on productive and unproductive labor, the main attention has always been paid to production, the movement of a material product, indicators of intersectoral balance, as well as indicators of the balance of reproduction of national income for the main divisions of the economy, balances fixed assets and national wealth. And this is correct, since only what is produced can be consumed, accumulated and exchanged. Based on the foregoing, we can conclude that the problems of a theoretical nature in the Russian economy as a whole, at present, are reduced to the definition and development of an integral and interconnected system of macroeconomic balances, the indicators of which are calculated on the basis of tools and parameters of various areas of state socio-economic policy, enshrined in normative-legal acts. The balance of macroeconomic indicators and state policy parameters is carried out both in the institutional sectors of the economy and within the entire economy as a whole, is achieved at each level of balancing, respectively, through the use of end-to-end indicators of the system of balances and through the development of a consolidated balance of resource flows. The validity of developing a forecast of macroeconomic indicators of the system of balances is achieved through the use of methodological approaches in practical calculations that allow linking economics and politics on the basis of interrelation and mutual influence. The interrelation and mutual influence of indicators of an integral system of balances are due to the use of a methodology for calculating indicators based on regulations, that is, through the use of tools and parameters of various directions carried out through public policy. It follows that the theoretical problems of the formation of the SNA, first of all, are inextricably linked with problems of a conceptual nature, organizational and legal problems, methodological and others.
Statistical issues. The transitivity of forms of relations (the specifics of forms of ownership and their transformation), their instability, the emergence and functioning of special transitional economic forms, which are a manifestation of the mixing of old and new, as well as the expression of contradictions with traditional systemic forms, that is, the very system of socio-economic relations of a transitional society, creates certain difficulties for the state statistics authorities in the formation of a correct information base for building the SNA according to the complete scheme and forecasting authorities for the development of a comprehensively substantiated scheme of socio-economic development. Russia for the future. One of the important problems associated with the introduction of the SNA into the statistical practice of economic calculations in Russia is the restructuring of the previously existing reporting system and the creation on its basis of a new one adequate to the basic concepts of the general SNA. A logical continuation of work to improve the information base of statistics is the development and implementation of the USREO, which accumulates information about all organizations that have passed state registration, regardless of their organizational and legal form, form of ownership and types of activity. The need to obtain macroeconomic indicators in accordance with the principles of the SNA requires the revision of previous reporting forms, amendments to them, the development and introduction of new ones, as well as the conduct of surveys. However, the imperfection of the new reporting standards in the primary accounting of some indicators, as well as the different interpretation of concepts, their interpretation by various institutional units create certain difficulties for the transition of enterprises and organizations to the SNA.
Analysis is the final stage of any statistical research. Analysis of the development of the economy, as a rule, is carried out in order to identify the main relationships and proportions of social production; the degree of influence of individual factors on the results of economic activity; obtaining theoretical conclusions; formation of expediency and directions for further improvement of the statistical methodology used; formulation of practical conclusions about the main trends in the development of socio-economic processes and their effectiveness. The existing system of accounting and statistics was formed in the conditions of the administrative-command methods of managing the economy, was directly dependent on methodological foundations central planning and was based, as a rule, on continuous statistical observation. The composition of the system of indicators was formed taking into account the need to ensure the management functions of ministries and departments.
Changes in the system of economic relations in the country, associated primarily with the introduction market relations, intensive development of the non-state sector of the economy, processes in social sphere, determine the use of new methods of statistical observation; new approaches to the formation of an information base - a system statistical indicators, developed by state statistics, refers to a more complete convergence of methods for the formation of statistical information with the standards adopted in the practice of developed countries and international economic organizations.
The analysis of generalizing economic indicators and their relationship in dynamics allows us to assess the correctness of the current economic policy of Russia and take timely measures to correct economic activity and foreign economic relations.
Chapter 3. Analysis of the state of the economy based on specific macroeconomic indicators.
The use of the SNA in domestic practice makes it possible to obtain a number of important macroeconomic indicators necessary for assessing and analyzing the functioning of the national economy and developing economic policy. The most important of them are: gross domestic product; gross national product; national income; national savings; disposable income; final consumer spending for goods and services; gross investment; foreign trade balance; the balance of current transactions with foreign countries, etc. Based on these data, the current trends in the development of the national economy are assessed, their changes are predicted, and economic policy and measures for its implementation are developed.
Let's visually get acquainted with the analysis of the state of the economy based on specific macroeconomic indicators. The article “Analysis of the rates economic growth(according to the data of national accounts for 1995-1999)" in the journal "The Economist", 2000, No. 6.
ANALYSIS OF ECONOMIC GROWTH RATES
(according to national accounts data for 1995-1999)
L Artemova, A Nazarova.
Overview of the main economic indicators of the SNA for 1995-1999.
Under the influence of understanding the key problems of socio-economic development in society, the need to strengthen the role of the state in regulating the economy, as well as linking the goals of economic policy with the interests of the whole people, is increasingly recognized. In connection with the establishment of a system of macroeconomic regulation, the importance of forecasting calculations is increasing, which characterize the current processes of expanded reproduction and help assess the prospects for growth in production, final consumption and accumulation. The development of general economic forecasts involves an interconnected analysis of various aspects of social reproduction, production, distribution, exchange and consumption. The predictive capabilities of such an analysis become especially significant if it is carried out on the basis of the main indicators of the system of national accounts, which are developed for reporting period State Committee of the Russian Federation.
Let's try to consider from this angle the consolidated macroeconomic indicators for the period 1995-1999 (Table 1)
Table 1
Change in the dynamics of the main socio-economic indicators (in% to the previous year)
| Year | 1995 | 1996 | 1997 | 1998 | 1999 |
| GDP | 95,9 | 96,6 | 100,9 | 95,1 | 103,2 |
| Industrial products | 96,7 | 96,0 | 102,0 | 94,8 | 108,1 |
| Agricultural products. | 92,0 | 94,9 | 101,5 | 86,8 | 102,4 |
| Fixed assets | 100,2 | 99,96 | 99,6 | 99,5 | 99,5 |
| Investments in fixed assets | 89,9 | 81,9 | 95,0 | 93,3 | 104,5 |
| turnover retail | 93,6 | 99,5 | 103,8 | 96,7 | 92,3 |
| Paid services to the population | 82,3 | 94,1 | 105,6 | 99,5 | 102,6 |
As the above data show, there has been a decline in all the main indicators of economic development from year to year. Only in 1997, there was a slight growth in the gross domestic product, industrial and agricultural products, but in the next year, 1998, the GDP fell again. In 1999, a more noticeable increase in GDP and industrial output was noted. However, in general, in relation to 1990, GDP in 1999 amounted to only 59.5%.
However, since 1999 there have been some positive developments in the economy. We can speak of them as an increase in industrial production, investments, a slowdown in inflation, some improvement in the financial condition of enterprises. The volume of industrial production increased by 8%.
The question is relevant: how stable are the marked shifts? Their immediate factors seem obvious. First, in the second half of 1998, due to the financial crisis, the effect of the devaluation of the ruble began to take effect, as a result of which production began to grow in a number of industries due to the replacement of imports that had risen in price. Secondly, exports of raw materials and energy resources increased, in particular due to the rise in world oil prices. In addition, in 1998 there was the largest drop in industrial production (-14.5%), i.e. growth came from a very low base.
It should be noted that the largest decline in production since 1992. to 1999 was in the final demand sectors (light industry, agriculture, building materials industry, mechanical engineering and metalworking). Thus, while in 1999 the gross output of industry as a whole decreased by 46% compared to 1992, the decline in the sectors of extraction and primary processing of raw materials was much less: the production of the electric power industry decreased by 25%, the fuel industry - by 29%, non-ferrous metallurgy - by 36%. %. At the same time, in the sectors of final demand, the decline was: in light industry - 85%, in agricultural products - 42%, in the building materials industry - 63%, in mechanical engineering and metalworking - 53%.
Given the predominantly opportunistic nature of the factors that caused the analyzed recovery, it should be recognized that the development of positive processes is unstable and does not yet provide sufficient prerequisites for growth based on the renewal of the production apparatus and technologies. Moreover, in the current year, the increase in domestic production, which was due to the devaluation of national currency. It is impossible not to see the manifestations in the economy of the following negative factors: the lag in the dynamics of wages from inflation caused, on the one hand, an increase in the efficiency of industrial enterprises and an improvement in their financial condition and, on the other hand, a decrease in the demand of the population. In 1999 final consumer demand fell by 5%, while low income levels and an uneven distribution of income remained, which limited growth domestic market and expanded reproduction.
In 1999, the dynamics of GDP production by industry changed significantly. With a general GDP growth of 3.2%, the increase due to the production of goods amounted to 6.4%, and the production of services - 1%, while in previous years, the production of GDP due to goods decreased at a faster rate than the production of services (Table 1). 2).
Change in the dynamics of the main socio-economic indicators
Structure of GDP production in current prices, in % of the total). table 2
In the volume of GDP production in 1999. increased the share of goods and net taxes. An analysis of the formation of primary income in the production of goods and services shows an increase in the problem of labor motivation, since the share of wages decreases from year to year and the share of taxes on production and imports grows (Table 3).
The system of national accounts developed by the State Statistics Committee of the Russian Federation provides for a general interconnected description of the economic process for the economy as a whole and for sectors and makes it possible to analyze reproduction. The distribution of primary incomes shows how incomes created in some sectors - producers of added value, come in the form of primary incomes to other sectors - income recipients (Table 4). Wage data captures the wages received by residents of a given country and makes it possible to analyze the bulk of the income of the household sector. Taxes on production and imports are the main source of income for the government sector. Gross profit and mixed income is the primary income of corporations (non-financial, financial, as well as non-cooperative enterprises and personal farms)
Structure of income generation Table 3
Structure of the use of the VFD Table 4
| Of the year | 1995 | 1996 | 1997 | 1998 | 1999 |
| GNRD | 100 | 100 | 100 | 100 | 100 |
| households | 59,0 | 62,3 | 61,3 | 65,1 | 61,8 |
| State institutions | 23,9 | 19,6 | 23,5 | 21,3 | 23,0 |
| Non-financial enterprises (NPOs) | 17,1 | 18,1 | 15,2 | 13,6 | 15,2 |
| 71,8 | 72,9 | 78,0 | 81,8 | 74,1 | |
| households | 49,8 | 49,8, | 52,2 | 57,8 | 55,2 |
| State institutions | 19,6 | 20,6 | 22,2 | 20,3 | 16,0 |
| Nonprofit Organizations Serving Households (NPOs) | 2,4 | 2,5 | 3,6 | 3,7 | 2,9 |
| Gross saving | 28,2 | 27,1 | 22,0 | 18,2 | 25,9 |
| households | 9,2 | 12,5 | 9,1 | 7,4 | 6,6 |
| State institutions | 4,3 | -1,0 | 1,3 | 0,09 | 7,1 |
| Non-financial enterprises, financial institutions and non-profit institutions serving households | 14,7 | 15,6 | 11,6 | 9,9 | 12,2 |
Ultimately, gross disposable income, both for the economy as a whole and for economic sectors, is allocated to expenditures for final consumption and savings, which can be used to finance savings. From the given data in comparable prices, it follows that gross savings systematically decreased, with the exception of 1999 (Table 5)
Table 5
Dynamics of gross savings
The state of resources and their use to finance gross capital formation at the expense of domestic and external sources in general for the economy and by sector can be analyzed based on the data of the capital account (Table 6)
Table 6
Capital account
| Of the year | 1995 | 1996 | 1997 | 1998 | 1999 |
| Resources, total | 28,2 | 27,1 | 22,0 | 18,2 | 25,9 |
| Gross national saving | 0,9 | 0,7 | 0,5 | 0,6 | 1,1 |
| Capital transfers from the rest of the world | -1,0 | -0,8 | -0,7 | -0,8 | -1,2 |
| Usage, total | 28,1 | 27,0 | 21,8 | 18,0 | 25,8 |
| Gross capital formation, total | 25,7 | 24,9 | 23,8 | 16,3 | 16,3 |
| Fixed capital | 21,1 | 21,6 | 19,7 | 18,3 | 15,7 |
| Working capital | 4,2 | 3,5 | 3,8 | -2,2 | 0,4 |
| Net acquisition of value | 0,4 | -0,2 | 0,3 | 0,2 | 0,2 |
| Net lending or net borrowing | 2,4 | 2,1 | -1,3 | 1,7 | 11,1 |
| Statistical discrepancy | 0,0 | 0,0 | -0,7 | 0,0 | -1,6 |
As we can see, in 1999 gross national saving increased, but gross fixed capital formation did not increase. A few recovered material circulating assets. With a lack of domestic savings for gross capital formation and capital investment more and more attention is drawn to the problem of rational loading of the existing production potential.
Based on the calculations of the IMEI under the Ministry of Economy of the Russian Federation, economic crisis in Russia led to the accumulation in the production sector of a huge amount of unused equipment, including physically worn out. In 1991-1998. (according to the calculations of the IMEI), the utilization of the production potential of industrial enterprises decreased to 50% against 88 in the pre-reform period. "At large and medium-sized industrial enterprises, it decreased by almost 3.5 times. Production capacities (in terms of the nomenclature of the balance of capacities) are only 25% loaded The lack of investment, especially during the crisis, led to the aging of production potential, and the problems of marketing products and insufficient utilization of production capacities led to an absolute reduction in production potential and the disposal of equipment without compensation for its new commissioning. domestic demand, and this will lead to an increase in economic activity in the manufacturing sector and the ability to replace imported products. However, these factors are constrained by the fact that there is no active growth in domestic demand, investments are limited, and funds are needed for at least a minimal reconstruction of existing production capacities. Therefore, the majority of idle capacities cannot be a long-term factor in sustainable economic growth.
In industry, more than 70% of all machines and equipment have been in operation for more than 10 years. The share of relatively young equipment aged 5 years, which determines the technical and technological level of production, decreased from 29% in 1990 to 5% in 1997. We also note that the average actual service life of both the fixed capital as a whole and its active part (machinery and equipment) already by 1990 significantly exceeded the standards.
The average age of industrial production equipment has reached almost 16 years, and the average actual life of their equipment is almost 32 years. On the basis of such equipment, enterprises are not able to produce competitive products. Therefore, unloaded capacities can hardly be considered as a long-term factor in economic growth. Sustained economic recovery. taking into account the low technical and technological level of capacity, it is possible only with large internal savings - sources of investment.
The final use of GDP includes expenditures on final consumption of material goods and services of households and public institutions, gross fixed capital formation, tangible assets and valuables, net exports of goods and services (Table 7)
Table 7
End use of GDP
(in current prices, in % of the total)
| Of the year | 1995 | 1996 | 1997 | 1998 | 1999 |
| GDP used | 100 | 100 | 100 | 100 | 100 |
| Final consumption expenditure | 71,1 | 71,4 | 74,4 | 77,1 | 68,6 |
| Households | 49,3 | 48,8 | 49,8 | 54,4 | 51,0 |
| Government institutions | 19,4 | 20,2 | 21,2 | 19,2 | 14,8 |
| Gross capital formation | 25,4 | 24,4 | 22,7 | 15,4 | 15,1 |
| fixed capital | 20,9 | 21,2 | 18,8 | 17,2 | 14,5 |
| Net exports of goods and services | 3,5 | 4,1 | 2,9 | 7,4 | 16,3 |
The structure of the use of disposable income, starting from the III quarter of 1998, under the influence of financial crisis worsened significantly. In 1999 this trend continues. Decreased domestic demand for goods and services from households. The decrease in demand was influenced by the low level of incomes of the population and their uneven distribution (Table 8).
Table 8
Changes in the main socio-economic indicators of the standard of living of the population
(in % to the previous year)
There was a sharp stratification of incomes of the population. Thus, in 1998 in Russia the incomes of the 10% of the rich exceeded the incomes of the 10% of the poor by 24 times, while in the USA and Great Britain it was 4 times, and in Germany it was 3 times. In 1998 per capita cash income 86% of the population had from 400 to 1000 rubles, and the remaining 14% had more.
In 1999 in comparison with 1998, the real incomes of the population decreased by about 15% in general. The decline in domestic demand limits the growth of the domestic market and the production of goods and services for final consumption. The share of gross capital formation, including fixed capital, also decreased.
The total domestic demand for consumption and investment decreased against the corresponding year in 1998. - by 9%, and in 1999. - another 2%. In 1999, the used gross domestic product was less than 60% of the 1990 level (in comparable terms), including final consumption expenditures - 77%, gross capital formation - 16%, while net exports of goods and services increased by 94%. times. This results in a redistribution that is negative for the domestic economy: domestic resources are increasingly directed abroad. Such a structure for the use of the gross domestic product does not meet the objectives of expanded reproduction and the solution of socio-economic problems for sustainable economic growth.
Calculation of economic growth rates
Based on the analysis of the results of economic development for 1997-1999. we have calculated two versions of the economic growth forecast for 2000. GDP growth rates are determined by socio-economic objectives and real opportunities in accordance with the available reproduction resources.
Forecast of GDP growth rates using the production account method. Determination of possible rates of economic growth involves solving a number of complex problems, especially taking into account the actual state of the Russian economy, when for the period from 1992 to 1998. negative indicators prevailed. With a significant influence of the noted market factors, it is difficult to analyze the interrelated factors of growth dynamics and draw certain conclusions. However, since there are well-known relationships between production growth rates, capital accumulation and capital intensity (or capital intensity) of production growth, we tried to explore trends in: the dynamics of gross output, the share of GDP in gross output, the dynamics of fixed assets (capital), capital productivity (or capital intensity).
Change in the dynamics of the total value of cash fixed assets for 1995-1999. shows that their decline occurred annually, mainly due to the reduction in industries that produce goods. Given the level of their actual use, the reduction was even greater.
In 1999, it was in this group of industries that the growth in gross output associated with import substitution, which eventually led to an increase in gross output in the economy as a whole, led to a significant increase in capital productivity (by 3.8%), while it decreased by 5% in the previous year. In service industries, there was no significant increase in capital productivity. In 1999, its growth here amounted to 100.2%, with a decrease of 1-3% in previous years.
Since the trends of 1999, which developed against the backdrop of the crisis situation of 1998, are not indicative, and the reserves of import substitution have been largely exhausted, the prerequisites for the forecast for 2000 are not indicative. take into account both data from previous years and long-term goals for achieving economic growth.
The first version of the forecast assumes an increase in capital productivity in the economy as a whole by 2%, subject to the stabilization of funds. At the same time, in industries producing goods, its growth will be 3%, and in industries providing services - 1% against 1999. If these prerequisites are met, the gross output in the economy as a whole will increase by 2%, and the growth of the gross domestic product, while maintaining its share in the gross output, will be 2%. In the second option - with an increase in capital productivity by 4% - GDP growth will also be 4% (Table 9).
Table 9
Changes in the dynamics of the main factors of RR growth
(in % to the previous year)
| Of the year | 1997 | 1998 | 1999 | 2000 | |
| 1 var | 2 var | ||||
| Gross output by economy, total | 100,6 | 94,6 | 103,3 | 102 | 104 |
| 100,5 | 93,5 | 106,5 | 103 | 105 | |
| 100,7 | 95,9 | 100,6 | 101 | 103 | |
| Fixed assets (at the end of the year) | 99,6 | 99,5 | 99,5 | 100 | 100 |
| in industries that produce goods | 98,6 | 98,6 | 98,6 | 100 | 100 |
| in service industries | 100,4 | 100,4 | 100,4 | 100 | 100 |
| Capital productivity in the economy, total (1:2) | 101,0 | 95,0 | 103,8 | 102 | 104 |
| in industries that produce goods | 101,9 | 94,6 | 108,0 | 103 | 105 |
| in service industries | 100,3 | 95,5 | 100,1 | 101 | 103 |
| GDP produced | 100,9 | 95,1 | 103,2 | 102 | 104 |
Forecast of GDP growth rates by end-use method. The forecast of changes in the dynamics of the gross domestic product (on the demand side) can be determined by the elements of final use: the consumption of material goods and services, gross capital formation and net exports.
The lower limit of the volume of consumption of material goods and services can be determined by the general socio-economic conditions for the development of the national economy, the achieved level of consumption on average per capita and the change in the dynamics of population growth, as well as the growth in consumption per capita.
In our calculation for the forecast period, the following conditions are assumed: growth achieved level consumption on average per capita in the first variant - by 2%, in the second - by 4%; a certain change in population dynamics (Table 10).
Accepted forecast assumptions
Table 10
Bearing in mind the huge differentiation of incomes by population groups, the rise in the level of consumption can be ensured by narrowing this gap, which will lead to an increase in the demand of the population. To do this, it is necessary to solve a number of specific tasks on wages in the sphere of production of goods and services. Taking into account the assumed assumptions, the volume of final consumption in 2000 will increase against 1999. by 2-4%, with a decrease in the number of 0.3%. The forecast of the total volume of gross capital formation is connected with the calculations of the forecast of the volume of investments in fixed assets, the balance of funds and their use.
To achieve sustainable growth rates, it is necessary to sharply increase the rate of accumulation in GDP, although in the coming years a significant increase in the share of gross capital formation seems problematic. In our opinion, the way out of the economy from the crisis is possible only by relying on the available capacities and involving part of them in the economic turnover. This is necessary in order to improve the health of getting rid of unused equipment, for which an inventory and sanitation of production facilities should be carried out. It is also necessary to consider the issues of taxation and depreciation charges for unused capacities and take the necessary measures to implement measures to implement: an industrial policy aimed at stimulating domestic demand; restructuring of industry; development of investment programs for the re-equipment of industries; creating the necessary conditions for enterprises to sell unused equipment; solving a number of socio-economic problems to reduce the differentiation of income and consumption in order to revive the demand of the population; rationalization of foreign trade.
The two options for forecasting gross capital formation take into account the relationship between the growth rate of the produced gross domestic product and the growth of gross capital formation, as well as between the growth rate of final consumption and gross capital formation.
Analysis of the relationship between the dynamics of GDP and the dynamics of gross capital formation for 1992-1999. shows: with an increase in gross fixed capital formation by 1%, GDP growth is 0.3%. Assuming GDP growth in 2000. within 2-4%, this will require an increase in gross capital formation by 5-11%, final domestic demand will increase by 2-5% (Table 11).
Table 11
Forecast indicators of gross capital formation
When forecasting the total volume of the gross domestic product used, it is necessary to take into account the balance of foreign trade (export and import of goods and services). The volume of exports of goods for the forecast period was determined depending on the situation of demand in world markets, production capabilities and growth in demand from the domestic market. In 2000, exports are projected at the 1999 level.
The fulfillment of the requirement of a balanced economy, in which the demand for a product corresponds to its supply, is estimated on the basis of the main national accounts identity: GDPd - C + 1 + X - M, where GDPd is GDP used; C - final consumption of material goods and services; I - gross accumulation; X - export of goods and services; M - import of goods and services.
Equating the produced and used GDP in forecast calculations, we get: GDP = C + I + X - M, whence GDP + M = C +1 + X.
The right side of the balance sheet shows the aggregate demand placed on production by the sectors of the domestic economy (C + I) and the outside world (X). On the left side - the aggregate supply, which is the value of the GDP produced in the country (GDP) and import deliveries (M). Conventionally, this identity is also valid for percentage changes: %GDP + %M = %C + %1 + %X.
Aggregate demand(C + 1 + X), calculated according to the parameters of end use, determines the required amount of aggregate supply. The domestic supply of the product, in turn, is limited by the level of GDP calculated by the production method. The excess of aggregate demand over supply (i.e., the missing amount of supply) is covered by import supplies, i.e. the required import dynamics is the estimated residual value: % Md " %C + %1 + %X - %GDP.
The calculation of imports is its forecast from the demand side (M), i.e. shows how much imports must be attracted to meet the domestic demand of the economy. With this approach to the forecast, the volume of imports, calculated from the demand side, remains at the level of 1999, i.e. its dynamics is close to 0. The forecast of imports from the demand side is linked to its calculation from the supply side or based on the forecast of the country's balance of payments (Table 12)
Table 12
Foreign trade balance according to the forecast for 2000
Having determined the dynamics of GDP for final use and production, we iterate their convergence, and after that, having adopted the main variant, we adjust all parameters of the formation, distribution and redistribution of income.
The sum of elements of GDP use (C + I -t X - M) in comparable prices of 1999 in the first variant shows a possible growth in the gross domestic product used at the level of 2%, and in the second - up to 4% (Table 13).
Table 13
To link all the main economic indicators of the SNA as a whole, calculations are made on the formation, distribution and redistribution of gross national income on the main economic sectors and adjusted financial program, i.e. requirements for monetary and fiscal areas. When carrying out iterative calculations, a choice of options is provided, based on the need to: fulfill external obligations; ensure expanded reproduction; solve socio-economic problems within the country; provide economic security country, taking into account the possibilities of production, consumption and accumulation. The accounts of generation and distribution of income show the parameters of wages, taxes and profits at the macro level; secondary distribution account - parameters of current taxes and deductions, social payments and other payments. The main option for calculating indicators at the macro level should be linked to the country's balance of payments, as well as the possibilities of financing gross capital formation from internal and external sources.
Conclusion.
The SNA is the most common balance method of statistics on the development of the economy and its results, reflects the results of the production of goods and services, the sources of income from all types of economic activity, the contribution of each institutional unit, each sector of the economy and industry to their creation and participation in their distribution and use, and also in the accumulation of national wealth. The purpose of national accounting is to give a clear digital display of the state of the country's economy over a certain period of time. The system of national accounts, using a closed system of accounts and a number of additional tables, shows the nature of economic processes and the main macroeconomic indicators: GNP, GDP, ND
Although the SNS emerged much later accounting, she adopted many of his general principles, for example: the principle double entry each transaction, the distinction between assets and liabilities, the evaluation of individual items of income and expenses, etc. This commonality lies in the fact that, ultimately, the goal of both accounting and reporting systems is to provide information for decision-making related to managing the economy and increasing it. efficiency, albeit at different levels. The transition to the SNS, one can say frankly, was an inevitable process. In a market economy, the old system of basic macroeconomic indicators pathologically could not be an effective tool for statistical accounting and display of global economic processes and their results. Unlike the national accounts of foreign countries, the domestic SNA provides for the possibility of distinguishing between the sphere of material production and the sphere of intangible services. The connecting link in the system of macroeconomic indicators is the coordinated indicators of the formation, distribution, redistribution and use of national income as a set of income from economic activity and the creation and movement of the final product as the main characteristic of the socio-economic development of both the country and the region.
In this work, special attention was paid to the importance of National Accounting for state regulation the latter is especially relevant in connection with the need to develop and implement strategic structural transformations in the economy. Based on practical material: The Economist magazine for 2000. Article No. 6 “Analysis of economic growth rates” (according to national accounts data for 1995-1999), one can trace the dynamics of changes in the main economic indicators of the SNA, analyze this dynamics, its impact on the economy and make appropriate forecasts. The ongoing variant calculations of macro indicators for the forecast period underlie the development of federal and consolidated budgets country, tax and monetary policy. In the national accounting literature, as a rule, the analytical, applied nature of the SNA is emphasized. This quality was, to a certain extent, a consequence of the very process of forming the SNA as a result of the development of the theory of macroeconomic analysis in relation to the requirements of economic policy.
It is no coincidence that the definitions of the SNA emphasize its integrity and complexity, it is noted that the SNA is “a way of describing ... the main economic phenomena that make up and characterize the economic and financial life of a nation over a certain period.
Bibliography:
1. Galperin V.M., Grebennikov P.I., Leussky A.I., Tarasevich L.S. Macroeconomics. Textbook.
2. Course of economic theory. Chepurin M.N. Kiseleva E.A.K. 1994 624 p.
3. Economic theory (political economy): Textbook. Under. Ed. V.I. Vidyapina, acad. G.P. Zhuravleva. M., 1997
4. Galperin V.M. Macroeconomics: Textbook - S.Pb, 1994
5. Economics: Textbook - Ed. Raizberga B.A. - M: Infra-M, 1997. - 720s.
6. Borisov E.F. Fundamentals of economic theory.-M.: New wave. 1999
7. Economic theory: Textbook / Ed. Ed. acad. IN AND. Vidyapina, A.I. Dobrynina, G.P. Zhuravleva - M .: Infra - M, 2002 - 714 p.
8. Economics: Textbook / Ed. Raizberga B.A. - M: Infra-M, 1997. - 720s.
Macroeconomic indicators are aggregated (cumulative) values that characterize the movement of the economy as a whole. One of the main such indicators is economic efficiency, understood as the ratio of the beneficial effect (result) to costs.
Economic efficiency in relation to the activity of a separate economic unit is not identical to efficiency on the scale of society.
The economic efficiency of the national economy is a state in which it is impossible to increase the degree of satisfaction of the needs of at least one member of society without worsening the position of another. This state is called Pareto efficiency (named after the Italian economist V. Pareto).
Efficiency should not be understood only as the result achieved by the national economy or a separate industry over a certain period of time, but rather an effect. The effect may be significant, but if it is achieved at a high cost, then the efficiency will remain unchanged or even decrease. Thus, efficiency is not an absolute value, but a relative one, indicating not only an increase in production indicators, but also the price (due to what costs) of the gains achieved.
World experience shows that the growth of efficiency is an objective, natural, stable, repetitive and causal process. The more civilized the society, the more important it becomes to increase the efficiency of production, as the need and understanding of the need to save the social costs of excessively increased production increases. Increasing the efficiency of social production is acquiring features economic law, which can be formulated as the law of increasing production efficiency.
The greatest increase in production efficiency is achieved with an intensive type of expanded reproduction, which is typical for modern stage development of society and economy of developed countries.
The main indicators of the efficiency of social production are the productivity of social labor (the ratio of the total social product to the number of workers in the sphere of material production), capital productivity (the ratio of national income to the average annual value of fixed assets and working capital), capital intensity (the inverse indicator of capital productivity), etc.
The result of the functioning of the national economy is the national product, which is measured by various macroeconomic indicators, such as: gross domestic product, gross national income.
Gross domestic product (GDP) is a general indicator that represents the total value of goods and services at market prices created by resident and non-resident institutional units within a country, using the country's factors of production over a certain period.
Its dynamics is used to assess the overall performance of the economy, and, therefore, to determine the relative success or failure of economic policy measures pursued by the government.
The GDP indicator measures the value of final products only (products used for final consumption, accumulation and export) and does not take into account the value of intermediate goods and services consumed in the production process (raw materials, materials, fuel, energy, etc.). Otherwise, double counting would take place, since the cost of intermediate products is included in the cost of final goods and services.
There are three ways GDP measurements:
By income (distributive method) - as the sum of incomes of individuals, joint-stock companies, private enterprises, as well as government revenues from entrepreneurial activities and government bodies in the form of taxes on production and imports.
GDP = W + R + I + P
where W - gross national income;
i - percentage;
P - profit;
By expenditures (final use method) - as the sum of expenditures on personal consumption, government consumption (purchase of goods and services), on capital investments and the balance of foreign trade.
GDP = C + I + G + X,
Where С - personal consumption expenses;
I - investments;
G -__ government spending;
X - net exports (as the difference between exports and imports);
By value added (production method) - as the sum of the added value of all producers at each stage of the production of the final product. This calculation method takes into account the contribution of various firms and industries to the creation of GDP. Eliminating intermediates solves the problem of double counting. For the economy as a whole, the sum of all value added must be equal to the sum of final goods and services. In Russia, at present, the most accessible and up-to-date information is data on the production of goods and services, collected by the State Committee on Statistics on the basis of the statistical reporting of enterprises, so the main method for calculating GDP is the production method.
Gross National Income (GNI) - serves to account for the totality of primary income received by residents of a given country in connection with their participation in the production of national enterprises located both on the territory of this country and abroad. When calculating, this indicator differs from the GDP indicator by an amount equal to the balance of settlements with foreign countries. If we add to the GDP indicator the difference between the income from factors of production (factor income) from abroad and the factor income received foreign investors in the territory of this country, then you get the GNI indicator. So both GDP and GNI refer to the entire economy, but one measures output (GDP) and the other measures income (GNI). GNI is a set of primary incomes received by residents as a result of their participation in production and from property. The GNI indicator is almost identical to the previously used GNP indicator.
GNI = GDP + Balance of primary income from abroad
Net domestic product (NDP) is a measure of net output in a given year. It is equal to gross domestic product minus depreciation charges.
FVP = GDP - Depreciation.
Traditionally in educational literature according to economic theory based on foreign sources, the net national product (NNP) was calculated. NNP = GNP - Depreciation. Today, this indicator has been replaced by NVP.
The NDP shows the annual output that the economy can consume without reducing the production possibilities of future periods. If we subtract the consumption of fixed capital from the GNI, we get the net national income (NNI).
National income (NI) is an important macroeconomic indicator, calculated differently in foreign and domestic economies. Previously, in Western statistics, it was equal to CHIP minus indirect taxes. AT new edition SNA indirect taxes are included in national income.
National income is the real income used in society for personal consumption and expanded reproduction. This indicator includes the following types of income: wages; income from property (dividends, % for a loan, rent); income of unincorporated entrepreneurship; retained earnings (after dividends and before taxes) of joint-stock companies.
Produced ND is the entire volume of the newly created value of goods and services.
Used ND is the ND produced minus losses from natural Disasters, storage damage, foreign trade balance.
According to the Marxist concept, ND is a newly created value only in the sphere of material production. In the Russian economy, ND is divided into: the consumption fund and the accumulation fund. The consumption fund is a part of the ND that ensures the satisfaction of the material and cultural needs of the population and society as a whole (culture, defense). The accumulation fund is a part of the ND that ensures the development of production. It is generally recognized that national income is created in industry, agriculture, construction, transport communications, as well as in trade and public catering, in the service sector (public and private), where the process of value creation continues.
The distribution of national income, in a broad sense, covers all spheres of social production: direct production, distribution, exchange and consumption.
In the process of direct production, the result of the distribution of national income is the receipt of a necessary and surplus product. At the stage of distribution, the necessary and surplus products are divided into primary incomes in the form of wages, profits, interest, rent, dividends, rent, etc.
After the distribution of the national income, it is redistributed through the mechanism of pricing in the sphere of circulation, the payment of various types of taxes to the state budget, social spending state, citizens' contributions to public, religious, charitable foundations and organizations. On the basis of the redistribution of national income, secondary or derivative incomes are formed, such as: pensions, scholarships, wages for non-material workers, benefits, etc.
Thus, as a result of the distribution and redistribution of national income, final incomes are created that are used for consumption and accumulation.
To characterize the standard of living, such macroeconomic indicators as: personal income and personal disposable income are used.
Personal income is the total income received by individual families before they pay taxes to the state. As such, personal income is not available in the SNA (System of National Accounts), but can be calculated by subtracting from the NI the three types of income that are earned but not received by individuals (social security contributions, corporate income taxes, retained earnings of firms) and adding income received by people, but not the result of their labor activity (transfer payments - pensions, scholarships, benefits).
Personal disposable income is the income of families and individuals that remains after taxes (LD minus taxes on citizens) and is spent on consumption and savings.
Disposable income is determined not only at the household level (HPL), but also at the level of the economy as a whole.
Gross national disposable income is used for final consumption and national saving and is obtained by summing GNI and net transfers from abroad (gifts, donations, humanitarian aid, etc.) less similar transfers transferred abroad.
The main macroeconomic indicator - GDP can be calculated in prices current year- this is nominal GDP, and in comparable (constant, basic) prices, which makes it possible to estimate the change in the physical volume of output over a certain period of time - this is real GDP. The value of nominal GDP is influenced by: the dynamics of the real volume of production; price level dynamics.
Real GDP is calculated by adjusting nominal GDP for a price index:
If the value of the price index is less than one, then there is an upward adjustment of nominal GDP, which is called inflation. If the value of the price index is greater than one, then deflation occurs - a downward adjustment of nominal GDP.
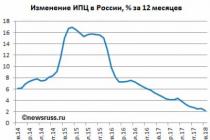
Consumer Price Indices (CPI) are used to assess changes in inflation rates, the dynamics of the cost of living. The CPI measures the change in the average price level of a "basket" of goods and services typically consumed by an average urban family. The composition of the consumer basket is fixed at the level of the base year. This indicator is calculated according to the type of Laspeyres index, or price index with basic weights (a set of goods fixed in a base year:
 Pi0 and Pi\" - the prices of the i-th good, respectively, in the base (0) current (t) period;
Qi° - the amount of the i-th good in the base period.
An index of this type does not take into account changes in the weight structure in the current period compared to the base one, which slightly distorts the result.
The price index is an implicit GDP deflator, which is calculated according to the type of Paasche index, that is, an index where a set of goods is used as weights current period:

Where is the amount of the i-th good in the current period.
If instead of Q we substitute the entire set of goods presented in GDP, and instead of P, respectively, their prices, then we get the GDP deflator. In fact, it is equal to the ratio of nominal GDP to real in the current period:
GDP deflator =
Unlike the Laspeyres index, the Paasche index underestimates the rise in the price level in the economy, since it does not take into account the dynamics of the weight structure, but fixes it already in the current period. If it is used to estimate the increase in the cost of living, then the effect on consumers of price increases for goods that were present in the base year set but not in the current year set will not be taken into account.
The Fisher index partly eliminates the shortcomings of the two previous indices by averaging their values:
pf = 
More on the topic 4. Macroeconomic indicators and how to measure them:
- Topic 8. National economy:\r\nresults and measurement.
- Inflation, its types and methods of measurement. Causes, mechanisms and socio-economic consequences of inflation
- Gross domestic product (GDP), gross national income (GNI). Counting Methods
- 8.3. Unemployment and inflation as a manifestation of macroeconomic instability and their socio-economic consequences
- 3. The results of reproduction at the macroeconomic level.
- 1. Macroeconomic indicators and methods for their measurement.
- Topic 5. "System of National Accounts and Main Macroeconomic Indicators"
- 3. RELATIONSHIPS BETWEEN THE MAIN INDICATORS OF THE SYSTEM OF NATIONAL ACCOUNTS
- Copyright - Advocacy - Administrative law - Administrative process - Antimonopoly and competition law - Arbitration (economic) process - Audit - Banking system - Banking law - Business - Accounting - Property law - State law and management - Civil law and procedure -
Main macroeconomic indicators: gross product, intermediate product, initial product, final product, gross national product, gross domestic product, national income, net national product, personal income, personal disposable income.
Let us dwell on the features of these indicators. The simplest of these indicators is gross product, calculated as a set of goods and services created in society over a certain period of time. Gross product includes: investment products (machines, equipment, vehicles, etc.); intermediate products (semi-finished products, components, products of an unfinished technological cycle); final products (commodities for households).
Gross domestic product - the total market value of all final goods and services produced in the territory of the country with the help of both domestic (owned by the country's citizens) and foreign (owned by foreigners) factors of production during one year.
Methods for calculating GDP:
1. By value added (production method). Value added is the difference between total sales revenue and the cost of intermediate products, that is, the cost of raw materials and materials that each manufacturer (firm) buys from other firms.
2. By expenses (end-use method). Consumer spending, gross investment, government final spending, net exports
3. By income (distributive method). Remuneration, rent, rent, interest on deposits, profit, depreciation, indirect taxes (VAT).
4. Gross regional product. GDP is calculated as the aggregate of gross regional products by territories.
System of National Accounts(SNA) - a set of statistical macroeconomic indicators characterizing the value of the total product (output) and total income, allowing to assess the state of the national economy. The SNA contains three main indicators of total output (output): GDP, GNP, net national product (NNP). Net national product is the annual value of final goods and services left for consumption after the replacement of decommissioned equipment.
The SNA also includes three measures of total income: national income (NI); personal income (LD); personal disposable income (PDI).
national income- total income earned by the owners of economic resources, i.e. sum of factor incomes :
Personal income- the total income received by the owners of economic resources.
personal disposable income– used income, i.e. owned by households.
47. Aggregate demand and aggregate supply: the concept and factors that determine them.
Aggregate Demand (AO)- the ability of economic agents to acquire GDP at different prices.
Aggregate supply (A5)- the ability of a business to produce GDP at different prices.
Aggregate demand- the ability of consumers in macroeconomics to purchase final goods and services (i.e., GDP) at different price levels. Aggregate demand (AP) is the sum of surveys of all macroeconomic agents (households, firms, the state and the foreign sector) for final goods and services. The components of aggregate demand are: household demand (FROM); firm demand (G); demand from the state (C); demand of the world economy. The demand components correspond to the calculation of GDP by expenditure. The value of aggregate demand is the amount of final goods and services that will be demanded by all macroeconomic agents at each given price level (RG).
In macroeconomics, the law of demand also operates - the higher the price level, the lower the aggregate demand. Aggregate demand is inelastic (when prices rise by 10 times, demand decreases by 6 times), since basic needs must be satisfied.
Aggregate supply (A5) - the quantity of final goods and services that all producers offer to the market. This is not about the actual volume of production, but about the amount of total output that all producers are ready to produce and offer for sale on the market at a certain price level.
The determinants of supply in macroeconomics are essentially the same as the determinants of supply in microeconomics (resource prices, the number of sellers, taxes on business, business subsidies, scientific and technological progress).
For macroeconomics, under certain conditions, the law of supply is valid: the higher the prices, the more goods are offered for sale. Aggregate supply is inelastic; due to rising prices, incomes grow faster than output.
Send your good work in the knowledge base is simple. Use the form below
Students, graduate students, young scientists who use the knowledge base in their studies and work will be very grateful to you.
Posted on http://www.allbest.ru/
INSTITUTE OF LAW AND ENTREPRENEURSHIP
Department of Economics and Entrepreneurship
Control Work on discipline:
"Economic theory" on the topic:
"Main macroeconomic indicators and methods for their measurement"
Fulfilleda:
student of group 1211 of the 1st course of the correspondence department
Krotkevich Irina Viktorovna
Checked: Smirnov M.O., Ph.D. PhD, Associate Professor
St. Petersburg-Pushkin 2013
Work plan
Introduction
1.2 Method of calculating GDP by expenditure
1.4 Nominal and real gross domestic product
Conclusion
gross domestic product welfare
Introduction
Macroeconomic theory operates with the most important aggregate indicators, which we will get acquainted with in this work. In contrast to microeconomic analysis, where the prices of individual goods and services were studied, in macroeconomics the most important indicator is the general level of prices. The methodology for calculating the most important macroeconomic indicators in different countries may be different, although in modern world Statistical services of countries with market economies widely use in their work the calculation methodology recommended by the UN statistical service.
On the basis of GDP, national accounts indicators are calculated, which are widely used in economic theory and statistics. The system of national networks links together the most important economic indicators - the volume of output of goods and services, the total income and expenses of society. The SNA is a modern system for collecting and processing information and is used in almost all countries for macroeconomic analysis of a market economy. It allows you to visualize the GDP (GNP) at all stages of its movement, i.e. production, distribution, redistribution and end use. Its indicators reflect the structure of the market economy, institutions and mechanisms of functioning. The use of the SNA is necessary for conducting an effective macroeconomic policy of the state, economic forecasting, and for international comparisons of national income.
Goals of the work:
1. consider the concept of gross domestic product and methods for its calculation;
2. expand the terms nominal and real gross domestic product;
3. study the concept of "system of national accounts";
4. consider gross domestic product and net economic wealth;
1. The concept of "gross domestic product" and methods of its calculation
Economic theory and statistics to measure the volume of national production use a number of indicators, among which the most important is the indicator of gross domestic product (GDP).
GDP is an indicator of national income statistics in the system of national accounts; expresses the total value of final goods and services produced in the territory of a given country, in market prices. In its in-kind form, GDP is a set of items and services used during a given year for consumption and accumulation. Gross domestic product is closely related to gross national product.
Gross output is the value of all goods and services produced in an economy over a given period of time. Gross output includes absolutely all goods produced in the economy, including those intended for the production of other goods and services. The latter constitute intermediate consumption, as opposed to final consumption.
1.1 Value added method
"GDP is the monetary value of all final goods and services produced in an economy in a year." This takes into account the annual volume of final goods and services created on the territory of a given country, or, in other words, within the geographical boundaries of a country or region.
For the correct calculation of GDP, it is necessary to take into account all products and services produced in a given year, but without repeated or double counting. That is why in the definition of GDP we are talking about final goods and services. These goods are consumed within households or firms, and do not participate in further production, unlike intermediate goods. If intermediate products are included in GDP, i.e. goods used to produce other goods, we will inevitably overestimate GDP. So, the price of the intermediate goods will be taken into account several times.
In other words, "value added is the market price of a firm's output minus the cost of raw materials consumed and materials purchased from suppliers."
By summing the value added produced by all firms in a country, one can determine the GDP, which represents the market value of all goods and services produced.
1.2 Method of calculating GDP by expenditure
This method follows directly from the first considered method of calculating GDP. Since GDP is defined as the monetary value of final products and services produced in a year, since it is necessary to sum up all the expenses of economic entities for the acquisition of final products. When calculating GDP based on spending, or the flow of benefits (this method is also called production method) the following quantities are summed up:
Consumer spending of the population (C).
Gross private investment in the national economy (Ig).
Public procurement of goods and services (G).
Net exports (NX), which represents the difference between a country's exports and imports.
Thus, the expenditures listed here constitute the volume of GDP, denoted in macroeconomic theory by the symbol Y, and show the market value of annual production:
Y= C+ Ig+ G+ NX
Household personal consumption expenditure (C) includes spending on durable goods, food, clothing and household items, and various services.
Gross private investment ( Ig), or capital investment is the sum of net investment ( in)(increase in the stock of durable capital goods, i.e. buildings and structures, machinery and equipment, inventories) and depreciation (d) during the year. Net investments imply a process of real capital formation, and not the acquisition of financial assets such as shares, bonds, etc., which are also called investments, but already within the financial sector of the economy. We emphasize that in this chapter we are talking only about the investment that increases production capacity.
The ratio between gross investment and depreciation, the amount of a country's capital consumed (or retired) in a given year's production, is a good indicator of whether an economy is booming, stagnant, or in recession.
Government purchases of goods and services (G) are the expenditures of state institutions and authorities at all levels for the purchase of goods and payment for the services of labor employed in the public sector. These public expenditures do not include transfer payments. “Transfer payments are gratuitous payments by the state, since they are not a payment for the service provided (for example, state benefits for poverty, unemployment, support for single-parent families, etc.).” Because they are not paid in exchange for the services of any factor of production, because they are not considered as factor income.
Net exports (NX) is the difference between a country's exports and imports, since most countries are open economies in which the government does not prevent the free movement of goods, capital, labor across national borders.
1.3 Method of calculating GDP by income (distributive method)
GDP can be represented as the sum of factor incomes (wages, interest, profits and rents), i.e. defined as the sum of remuneration of the owners of factors of production. At the same time, since we are talking specifically about the gross domestic product, it includes the income of both entities operating within the geographical boundaries of a given country, both residents and non-residents. Residents are citizens residing in the territory of a given country, with the exception of foreigners who stay in the country for less than 1 year.
The GDP indicator calculated using this method also includes indirect and direct taxes on enterprises, depreciation, property income and retained earnings. According to the diagram of the circulation of income and expenses, what is income for some subjects of the economy, for others - costs.
"Depreciation charges are another type of non-revenue payment that forms part of the cost of total production." The real expenditure on investment goods and the productive life of these goods do not coincide in time of accounting. To avoid grossly understating profits, and hence total income, in the year in which the purchase is made, and overstating profits and total income in subsequent years, individual firms calculate the useful life of their assets and allocate their total value more or less evenly over the entire life. Annual deductions that reflect the cost of capital consumed in the production process in individual years are called depreciation. Depreciation is an accounting entry that provides a more accurate picture of a company's earnings, and therefore, the company's gross income, in each year.
Strict accounting of profits and total income in the economy requires the inclusion of gigantic depreciation charges in the total amount of payments of the business sector. This depreciation charge is called fixed capital consumption expenditure and is a charge to replace investment goods "consumed" in the production process of a given year's GDP. This part of the business sector is not distributed as income among resource providers. These payments, which constitute a certain proportion of the cost of production, are production costs that reduce entrepreneurial profits. But unlike other production costs, depreciation does not increase anyone's income. If we talk about the physical volume of production in physical terms, the consumption of fixed capital is an indicator that some part of GDP should be set aside to replace the machinery and equipment used in the production process. In other words, the entire volume of GDP cannot be consumed as social income without undermining the accumulated productive capacity of the economy.
The salary figure includes the gross amount of wages, as well as additional payments to employees. Rent is the income of property owners. Profit breaks down into gross profit corporations or firms (dividends) and the net income of partnerships and sole proprietorships, as well as the income of farmers and freelancers.
The combination of two approaches to calculating GDP by expenditure and income can be considered in the following table:
Methods for calculating GDP
Both methods are considered equivalent and should result in the same GDP.
The concept of gross domestic product is inextricably linked with the concept of gross national product (GNP).
“GNP is GDP minus the sum of the added value created within the territory of the country through the use of factors of production owned by foreigners, plus the sum of the added value created abroad through the factors owned by the citizens of this country.”
The calculation of GNP is based on the criterion of ownership of a factor of production by a resident or non-resident of a given country. If we add to the GDP indicator the difference between the income from the services of factors of production (factor income) of residents from abroad and the factor income received by non-residents in this country, we get the GNP indicator. The difference between GNP and GDP for many countries is insignificant and fluctuates within + 1% of GDP.
1.4 Nominal and real gross domestic product
So, the composition of GDP includes goods (products) that are used for final consumption, accumulation and export. The nature of the products produced in the national economy is very diverse and the only way to determine their value is to present them in monetary (value) form. Otherwise, it is simply impossible to generalize the kilometers laid highways, tons of grain grown, thousands of meters of fabrics produced, millions of various services provided to the population. Therefore, GDP is a value indicator. This indicator, calculated in the prices of the current period, is called the nominal indicator, which does not establish the real content of GDP, i.e. does not show how much material goods and services are produced.
The nominal value is the calculated reference value against which real values deviating from it are compared. There may be significant discrepancies between nominal and real values due to changes in the purchasing power of money - an indicator that is inverse to the price level.
The real value of the indicator of the volume of production of GDP acquires if stable prices are used for calculations or their change is covered by price indices for consumer goods and services. Adjusted for changes in consumer prices, the value of real GDP is calculated.
Similarly, the real total income of the population is calculated as total income adjusted for purchasing power of money.
Since GDP is expressed in money, its value can increase due to price increases without changing the physical volume of production. Therefore, to compare GDP for different periods of time, the concept of a price index is introduced. It measures the ratio between the aggregate price of a certain set of goods and services in the current year and the corresponding price of the same goods and services in the base year.
The most commonly used is the consumer price index. It is calculated from the set consumer goods and services (the so-called consumer basket), which includes a set of the most important goods and services for the population. Consumer baskets are calculated systematically, they are used to judge standard of living population.
Statistical reporting deals with the actual nominal current prices of goods and services in the markets. But it is difficult to judge the actual situation in the economy from them. That is why it has to be corrected, i.e. take into account price changes relative to the base year, make adjustments for inflation and deflation. This makes it possible to measure and compare total output in different years, assuming a constant price level. To determine real GDP, it is necessary to divide the nominal GDP, expressed in current prices, by the price index
Thus, real GDP is nominal GDP adjusted by the price index. It excludes an increase in GDP due to rising prices.
The GDP does not take into account individual work in the household, does not reflect the change in the quality of products. Illegal labor activity is also not taken into account in the total GDP. Knowing the nominal and real GDP, we can calculate the GDP deflator
The GDP deflator is a coefficient used to recalculate GDP, calculated in monetary terms, in order to bring it to the price level of the previous year.
2. System of national accounts
In economic theory and statistics, interconnected indicators of national accounts, which are calculated on the basis of GDP, are widely used. The System of National Accounts (SNA) links together the most important macroeconomic indicators - the volume of output of goods and services, total income and total expenses of society. The SNA is a modern system for collecting and processing information and is used in almost all countries for macroeconomic analysis of a market economy. It allows you to visualize the GDP (GNP) at all stages of its movement, i.e. production, distribution, redistribution and end use. Its indicators reflect the structure of the market economy, institutions and mechanisms of functioning.
The SNA replaced the balance sheet of the national economy, which for a number of decades served in our country as a macrostatic model of a planned economy. The SNA as a system of macroeconomic indicators began to develop in a number of developed countries in the late 1930s, when government intervention in the process of economic regulation was required.
For the first time, in 1945, the principles of the SNA were put into operational form and published in the White Paper. The emerging problems of comparison in practice of macroeconomic indicators of the economies of various countries predetermined the need for standardization and unification of national accounts.
Special attention will be paid to the improvement of the SNA by international organizations and, above all, by the UN. The Standard System of National Accounts, developed by the United Nations Statistical Commission, has been in use since 1953. It was a system of six accounts that made it possible to assess the economic development of the country. In 1968 it was introduced a new version international standard SNA, which existed until 1993. The data of the accounts are summarized for the national economy as a whole, broken down by the following sectors:
1. Non-financial corporate enterprises engaged in the production of goods and services sold on the market.
2. Financial institutions and corporations (banks, Insurance companies, investment funds and other financial units, entities whose main function is financial intermediation).
3. Public administration bodies (this sector is formed at the expense of budgetary state units, the main function of which is the redistribution of income and wealth and the provision of non-market services to society as a whole).
4. Private non-profit organizations serving households (public, political, trade union, religious organizations, the main function of which is to provide non-market services to the participants of these organizations).
5. Households as consumers and investors.
6. The rest of the world, including foreign economic relations.
The use of the system of national accounts is necessary for conducting an effective macroeconomic policy of the state, economic forecasting, as well as for international comparisons of national income. The SNS performs several important functions, including:
measurement of production volumes for a certain period of time
identification of existing trends in the economy
organization of the economic policy of the state.
In general, the SNA recommended by the UN Statistical Service as an international standard for national accounting consists of two levels: consolidated accounts (reflect the movement of GDP, national income (ND), investment financing, transactions with other countries) and itemized accounts (show intersectoral relations, income movement, their distribution and final consumption).
Let us consider the most important indicators of the system of national accounts that characterize the movement of GDP at its various stages.
Net domestic product (NDP) is GDP less depreciation charges. With the help of the NDP indicator, one can measure the annual volume of production that the economy (enterprises, state, households) is able to consume without reducing the production possibilities of future periods: NDP = GDP - depreciation. Thus, only net investment is included in FVP. As for depreciation, it is part of gross investment and is included in GDP. Depreciation reflects the replacement of the stock of capital that was used in the current year.
National income (ND). To determine the indicator of the total amount of wages, interest, profit and rent, i.e. payments received in the production of GDP in a given year, indirect taxes on entrepreneurs must be deducted from the GDP. The meaning of this calculation is that the state, while levying indirect taxes on enterprises, does not invest anything in production, and therefore it cannot be considered as a supplier of economic resources. Thus, we get the indicator of national income (NI). From the point of view of resource owners, national income is a measure of their income from participation in production for the current period.
Disposable income (DI), or personal disposable income, is household income other than DI, which is earned income. It should be noted here that part of the earned income - social insurance contributions, corporate income taxes - does not go to the population. At the same time, transfer payments made by the state are not the result of an employee's economic activity, but represent part of their income. Thus, disposable income as income actually received can be calculated by subtracting social security contributions, corporate income taxes, retained earnings, individual taxes (income, personal property taxes, inheritance taxes) from national income and adding the sum of all transfer payments. Disposable income is at the personal disposal of members of society and is used for household consumption and savings.
3. Gross domestic product and net economic wealth (NEW)
Net economic wealth (NEW) is a macroeconomic indicator that takes into account the change in social welfare under the influence of factors not reflected in the GDP indicator. These factors include the general business activity, voluntary work, helping neighbors, charity, activities in the shadow economy, the availability of free time, leisure, environmental pollution, etc. The indicator was introduced into scientific circulation American economists W. Nordhaus and J. Tobin: in 1972
NEB = GDP - monetary value of negative factors affecting welfare + non-market activities (in monetary terms) + monetary value of free time. The whole difficulty lies in how to give a monetary value to all those activities that are not of a market nature and, therefore, cannot be valued in the process of free market exchange.
The indicator of net economic well-being is interesting, first of all, as a theoretical formulation of the problem of taking into account various aspects of the functioning of the economy, including the informal one. However, in practice, the statistical services of the United Nations and the national accounting services of individual states do not yet have a unified methodology for calculating net economic welfare.
Conclusion
Thus, the gross national product and other macroeconomic indicators are indicators of the economic state of society. Macroeconomic indicators are important for forecasting the economic development of the country, making the right decisions. And although various indicators of national income do not take into account non-market and illegal transactions, changes in the fund of free time and the quality of goods, the composition and distribution of aggregate output, as well as the environmental consequences of production, nevertheless, they are quite accurate and useful indicators of the economic state of the country.
By examining these indicators, we can quite accurately predict the development of the country as a whole, and individual sectors of the economy in particular. Recently, a number of new economic and mathematical methods for studying these indicators have appeared, so that it is possible to determine with great accuracy whether the economy of a particular country will develop or not.
Gross domestic product, the main indicator of a company's economic performance, is the market value of all final goods and services produced in a year. It does not exceed the GNP.
Transactions in intermediate goods, non-manufacturing transactions and trade in used goods are not included in GDP calculations.
GDP can be calculated by adding up the total expenditure on the entire output, or by adding the income derived from the production of a given output.
The cost method GDP is determined by adding consumer spending on goods and services, firms' gross investment spending, government purchases, and net exports.
Others can be deduced from GDP important indicators national accounts. NDP is GDP minus deductions for capital consumption. NI is the total income earned (created) by US resource providers; it is calculated by subtracting from the GDP net income and indirect business taxes. The FA is the total income paid to households before they pay individual taxes. RH is the personal income left after individual taxes have been paid. RC is that part of household income that they use for consumption and savings.
Price indices are calculated by dividing the price of a specific set, or market basket, of products in a given year by the price (value) of a similar market basket in base period and then multiplying the resulting quotient by 100. The GDP deflator, adjusted for inflation or deflation, and deriving real GDP from that.
Nominal (expressed in current prices) GDP measures the value of output produced in a given year at the prices that prevailed in the chosen base year. Real (expressed in constant prices) GDP measures the value of a given year's output at the prices that prevailed in the chosen base year. Because real GDP is adjusted for changes in the price level, it serves as an indicator of the level of manufacturing activity.
It is important to note that it is necessary to conduct a comprehensive study of these macroeconomic indicators, since only together they can give an accurate picture of the development of the economy of a particular country.
Bibliography
1. Gukasyan G.M. etc. Economic theory: Proc. M.; K., 2011.
2. Galperin V.M., Grebennikov P.I., Leusskii A.I., Tarasevich L.S. Macroeconomics: Textbook / General edition L.S. Tarasevich. St. Petersburg: School of Economics, 1994. 400 p.
3. Economic theory. Macroeconomics-1,2. Metaeconomics. Economics of transformations: Proc. / Edited by G.P. Zhuravleva. M., 2011.
4. Course of economic theory: textbook. 5th revised, supplemented and revised edition / ed. Chepurina M.N., Kiseleva E.A. Kirov: ASA, 2006.
5. Course of economic theory. General Basics economic theory, microeconomics, macroeconomics, transition economy: Tutorial/under. Tot. Ed. A. V. Sidorovich. M.: 2001.
7. Nosova S.S. Economic theory. Textbook. M.: VLADOS, 1999.
8. Course of economic theory: ed. Chepurina M.N., Kiseleva E.A. 2006.
Hosted on Allbest.ru
Similar Documents
Methods for calculating gross domestic product (GDP). Basic methods for calculating GDP. Methods of summing expenses and incomes. The relationship of indicators, the system of national accounts. GDP and net economic wealth. Transition economy in Russia.
term paper, added 11/15/2010
The system of national accounts as a method of socio-economic statistics, the principles of its construction. Gross domestic product, its forms and measurement methods. Analysis of the gross domestic product of the Republic of Belarus, features of changes in its dynamics.
term paper, added 12/24/2010
Gross domestic product (GDP) and methods of its calculation. Nominal, real and potential GDP. The concept and features of gross national income (GNI) and gross national product (GNP). The essence of the multiplier effect and the calculation of its magnitude.
test, added 11/20/2010
An indicator of the state of the country's economy. Methods for determining the volume of the national product. Purpose of using the System of National Accounts (SNA). Gross domestic product, gross national product, national income, net national product.
abstract, added 10/15/2008
Gross domestic product: general concept and basic principles. Added value of the company and how to determine it. The total cost of the final product. Place and role of the main indicators of the national economy. Methods for determining the gross product.
test, added 07/23/2014
Basic methods for calculating gross domestic product (GDP). GDP as the monetary value of all final goods and services produced in the economy in a year. Nominal and real GDP. Basic methods for assessing the shadow economy. Reasons for the inaccuracy of the GDP indicator.
test, added 03/26/2010
System of National Accounts (SNA) and its main macroeconomic indicators. Gross national product (GNP) - definition and calculation in the process of redistribution: a system of interrelated indicators. Gross domestic product (GDP) and its calculation.
term paper, added 04/18/2008
The concept of the system of national accounts. Gross domestic product (GDP) as the main indicator of the system of national accounts, methods of its calculation and difference from the gross national product (GNP). Analysis of the dynamics and problems of calculating GNP in Russia.
term paper, added 12/06/2013
Theoretical approaches to gross domestic product in domestic and foreign literature. Indicators and problems of measuring the gross product, statistical observation and analysis of the state of the country's national economy at the macroeconomic level.
term paper, added 09/30/2010
Key indicators of the System of National Accounts, the concept of gross domestic (national) product. Requirements for calculating GDP and GNP indicators. Definition of added value. Methods for calculating the gross product and national income in the economy.
Macroeconomic indicators are aggregated (cumulative) values that characterize the movement of the economy as a whole. One of the main indicators is economic efficiency, understood as ratio of useful effect (result) to costs. Economic efficiency in relation to the activities of a separate economic unit is not identical to efficiency on a social scale.
Economic efficiency of the national economy- this is a state in which it is impossible to increase the degree of satisfaction of the needs of at least one member of society without worsening the situation of another. This state is called Pareto efficiency (named after the Italian economist V. Pareto).
Efficiency should not be understood only as the result achieved by the national economy or a separate industry over a certain period of time, but rather an effect. The effect may be significant, but if it is achieved at a high cost, then the efficiency will remain unchanged or even decrease. Thus, efficiency is not an absolute value, but a relative one, indicating not only an increase in production indicators, but also the price (due to what costs) of the gains achieved.
World experience shows that the growth of efficiency is an objective, natural, stable, repetitive and causal process. The more civilized the society, the more important it becomes to increase the efficiency of production, as the need and understanding of the need to save the social costs of excessively increased production increases. An increase in the efficiency of social production acquires the features of an economic law, which can be formulated as the law of increasing production efficiency.
The greatest increase in production efficiency is achieved with an intensive type of expanded reproduction, which is typical for the current stage of development of society and the economy of developed countries.
The main indicators of the efficiency of social production are: productivity of social labor(the ratio of the national product to the number of workers in the sphere of material production); capital productivity(the ratio of national income to the average annual value of fixed assets and working capital); capital intensity(indicator, return on capital productivity), etc.
The result of the functioning of the national economy is national product, which is measured by various macroeconomic indicators, such as gross domestic product, gross national income.
Gross domestic product (GDP)- a generalizing indicator representing the total value of goods and services at market prices, created by resident and non-resident institutional units within the country, using the factors of production of this country for a certain period.
Its dynamics is used to assess the overall performance of the economy, and, therefore, to determine the relative success or failure of economic policy measures pursued by the government.
The GDP indicator measures the cost only end products(products used for final consumption, accumulation and export) and does not take into account the cost intermediate goods and services consumed in the production process (raw materials, materials, fuel, energy, etc.). Otherwise, there would be a recount, since the cost intermediate products included in the cost of final goods and services.
There are three ways to measure GDP:
By income (distributive method) - as the sum of primary incomes of individuals, joint-stock companies, private enterprises, as well as government revenues from entrepreneurial activity and government bodies in the form of taxes on production and imports;
By expenses (end use method) - as the sum of expenditures on personal consumption, government consumption (purchase of goods and services), on capital investment and the balance of foreign trade.
GDP= C + I + G + X,
where С – personal consumption expenses;
I - gross investment;
G - government spending;
X is net exports (as the difference between exports and imports).
By value added (production method) - as the sum of the added value of all producers at each stage of the production of the final product. This calculation method takes into account the contribution of various firms and industries to the creation of GDP. Eliminating intermediates solves the problem of double counting.
For the economy as a whole, the sum of all value added must be equal to the sum of final goods and services. In Russia, at present, the most accessible and up-to-date information is data on the production of goods and services, collected by the State Committee on Statistics on the basis of statistical reporting of enterprises, so the main method for calculating GDP is the production method.
Gross national income (GNI)- serves to account for the totality of primary income received by residents of a given country in connection with their participation in the production of national enterprises located both on the territory of this country and abroad. When calculating, this indicator differs from the GDP indicator by an amount equal to the balance of settlements with foreign countries. If we add the difference between the income from factors of production (factor income) from abroad and the factor income received by foreign investors in the territory of a given country to the GDP indicator, we get the GNI indicator.
Thus, both GDP and GNI refer to the entire economy, but one measures output (GDP) and the other measures income (GNI). GNI is a set of primary incomes received by residents as a result of their participation in production and from property.*
GNI=GDP + Balance of primary income from abroad
Indicators of GDP and GNI can be calculated not only on a gross basis, but also on a net basis, without taking into account the cost of production, which is directed to the restoration of consumed fixed capital.
Net domestic product (NDP) is a measure of net output in a given year.
NVP=GDP - Depreciation
It shows the annual output that the economy can consume without reducing the production possibilities of future periods. If we subtract the consumption of fixed capital from the GNI indicator, we get the indicator net national income (NNI).
National Income (ND)- this is the income produced by the factors of production in the process of their participation in the creation of GNP, or the cost of the resources used in this, or the total income received by all economic agents. Since all factors of production take part in the production of ND, it is distributed among their owners in accordance with their prices. From the point of view of resource providers, ND is a measure of their income from participation in this production, and from the point of view of entrepreneurs, ND reflects market prices used factors of production.
The SNA divides national income into five components according to the mode of income generation: wages, wages and bonuses; owners' income; rental income; corporation profit; net percentage.
Therefore, in economic theory and practice, nominal and real GDP indicators are calculated.
Nominal GDP calculated in the prices of the current year (at the time of calculation). Its value is influenced by the dynamics of the real volume of production, the dynamics of the price level.
Real GDP is calculated in comparable (constant, basic) prices, which makes it possible to assess the change in the physical volume of output over a certain period of time. Real GDP is calculated by adjusting nominal GDP for the price index:
Nominal GDP
Real GDP = Price Index (GDP deflator)