Analysis financial reporting companies
The Financial Statement of a company is single system data on the property and financial position of the organization and reflects information on:
- The financial position of the company.
- financial results of its activities.
- movements Money per reporting period.
In this regard, there are 3 main reports:
- Balance Sheet. Analytical report. Shows what the assets and liabilities of the company are at the date of the report.
- Profit and loss statement (Income Statement). Descriptive report. Shows how and why the company's retained earnings have changed.
- Cash Flow Statement. Descriptive report. Shows how and why the company's cash has changed.
In addition, in accordance with American standards (US GAAP), financial statements must include a statement of change equity(Statement of Changes in Equity) and notes to the reporting (Notes).
US GAAP and international standards do not regulate forms financial statements, but determine the requirements for the information provided, the content of the articles and the amount of information that must be disclosed in the reports and notes to them.
In the US, the balance sheet is usually presented for two years (reported and prior), while the income statement and cash flow statement are presented for three (reported and two prior) years. According to international standards, all reports are submitted for two years (reporting and previous).
Analysis of financial statements
Analysis of a company's financial statements is an important process in conducting a fundamental valuation of a company. Although past results do not guarantee future results, they help the investor understand the company's ability to reproduce profits and effectively manage resources.
Reading statements is often called express analysis, during which the investor performs.
- Horizontal (temporal) analysis: compares data over the years in relative and absolute terms.
- Vertical (structural) analysis: analyzes the structure of the report, determines the share of certain articles in the overall structure.
The essence of structural analysis is as follows:
- An indicator consisting of several elements is considered.
- The shares of each of the parts in the total value of the indicator are estimated (taken equal to 100%).
- It is concluded which of the parts made the largest (or smallest) contribution to the final value of the indicator.
Conducting a structural analysis allows you to evaluate the contribution of articles to the final indicator (horizontal structural analysis) and their dynamics over time and the share of growth (vertical structural analysis).
The essence of the factorial method is as follows:
- Based on the data received for the period, the articles of the reports are compared with each other.
- The ratios found form a group of indicators (coefficients).
- The calculated values of the indicators are compared with each other and/or with standard values.
Carrying out the factor method makes it possible to assess the compliance of the achieved indicators with those accepted as normative ones and to conduct a coefficient analysis.
- Ratio analysis compares the calculated indicators: for different periods, by line of business, by industry, with accepted normative values.
Prior to starting a rapid analysis, the investor should determine the questions that he wants answered in the research process. This will narrow the list of analyzed coefficients.
FEDERAL AGENCY FOR EDUCATION
MOSCOW STATE UNIVERSITY OF ECONOMICS,
STATISTICS AND INFORMATICS (MESI)
Institute of Economics and Finance
Graduate work
ANALYSIS OF FINANCIAL STATEMENTS
supervisor:
MOSCOW 2009
Introduction
1. Theoretical aspects analysis of financial statements
1.1 Characteristics and composition financial statements
1.2 New approaches to the preparation of financial statements
1.3 Financial statements of the enterprise as information base financial analysis
1.4 Basic methods and techniques for analyzing financial statements
2. Analysis of financial statements on the example of the plant "RMZ" combine "URALASBEST"
2.1 Organizational - economic characteristic enterprises
2.2 Analysis of the dynamics and structure of the asset and liability balance
2.3 Analysis of own working capital enterprises
2.4 Liquidity analysis balance sheet
2.5 Market sustainability analysis
2.6 Solvency analysis and type determination financial stability enterprises
Conclusion
List of used literature
Applications
INTRODUCTION
Analysis of accounting (financial) statements is a process by which the past and current financial position and performance of an organization are assessed.
The purpose of the analysis of accounting (financial) statements from the perspective of the user is to review and evaluate the information available in the statements in order to obtain reliable conclusions about the past state of the enterprise in order to predict its viability in the future.
As a result of the analysis of financial statements, the most important characteristics of the enterprise are also determined, which indicate, in particular, its success or the threat of bankruptcy.
For different users, the analysis of financial statements in terms of the scope of its implementation depends on the specific goal. At the same time, the nature of the analysis and the direction of work in the analysis of accounting (financial) statements may be different.
Analysis of the balance sheet involves the assessment of the assets of the enterprise, its liabilities and equity.
Analysis of the income statement allows you to evaluate sales volumes, costs, balance sheet and net profit of the enterprise.
According to the appendices to the balance sheet, it is possible to evaluate the dynamics of equity and other funds and reserves (according to the capital flow statement), inflow and outflow of cash in the context of current, investment and financial activities(according to the cash flow statement), dynamics borrowed money, accounts receivable and accounts payable, depreciable property and other assets and liabilities of the enterprise (according to the appendix to the balance sheet).
For all its importance, the analysis of accounting (financial) statements has limitations. First of all, the success of the analysis depends on the completeness and reliability of the reporting information. On my own technical analysis cannot provide the user with complete information about the enterprise. Depending on the specific goal facing the user, a certain decision is made not only on the basis of an analysis of accounting (financial) statements, but also on the basis of consideration of non-financial weaknesses and strengths enterprises.
However, financial analysis is one of the most important functions effective management. Mastering the methods of systemic integrated financial economic analysis is an integral part of the professional training of financiers, auditors, accountants.
Financial analysis includes many issues: it underlies the development of an enterprise's strategy and tactics, as well as control over their execution; allows you to obtain objective performance assessments and identify reserves for its improvement.
The goal may be a comprehensive analysis of accounting (financial) statements with the identification of strong and weak positions of the enterprise. The choice of goal determines the tools and methods for conducting the analysis.
The final stage of the analysis for the user is the assessment (interpretation) of the obtained data and indicators, which will serve as the basis for the adoption of certain management decisions or form the basis for planning future financial transactions and preparation of forecast accounting (financial) statements.
An analysis of financial results shows in which specific areas this work should be carried out, makes it possible to identify the most important aspects and the weakest positions in financial condition enterprises.
Analysis of accounting (financial) statements becomes information basis subsequent analytical calculations necessary for making managerial decisions.
Financial decisions are only as accurate as the information base is good and objective.
All of the above determines the relevance of this topic of the final qualifying work.
The object of the study is the analysis of financial statements.
The subject is the analysis of the financial statements of the RMZ plant of the Uralasbest plant.
The purpose of the work is to study the principles and methods of analyzing the financial statements of an enterprise and developing, on this basis, practical advice and conclusions.
Based on the goal, it is possible to formulate a range of tasks that need to be resolved in the process of considering this topic:
To study the specialized literature on this issue;
Consider theoretical basis analysis of financial statements;
Analyze the characteristics and composition of financial statements;
Consider new approaches to the preparation of financial statements;
analyze the financial statements of the enterprise as an information base for analysis;
Consider the main methods and techniques of analysis of accounting (financial) statements;
Conduct an analysis of the financial statements of the enterprise "RMZ" of the combine "URALASBEST";
To give organizational - economic characteristics of the enterprise;
Conduct an analysis of the dynamics and structure of the asset and liability of the balance sheet, own working capital of the enterprise, analysis of the liquidity of the balance sheet, analysis of market stability and solvency;
Structurally, the thesis consists of an introduction, two chapters, a conclusion, a list of references and applications.
The theoretical basis of the study is the materials normative documents, works of domestic and foreign experts in the field of financial analysis: L.A. Berstein, A.Z. Sheremeta, T.G. Vakulenko, L.V. Dontsova, N.A. Nikiforova, O.V. Efimova and others, popular science articles of periodicals and books edited by Novodvorsky V.D., Zavgorodniy V.P., Saifulin R.S.
The practical basis of the analysis is the financial statements of the RMZ plant of the Uralasbest plant: data from Form No. 1 “Balance Sheet” and Form No. 2 “Profit and Loss Statement” (Appendix 1-3).
The study used the main methods of financial analysis - horizontal, vertical, comparative, factorial, analytical grouping method, relative coefficients analysis method, etc.
1. Theoretical aspects of the analysis of financial statements
1.1 Characteristics and composition of financial statements
Reporting is a system of interrelated indicators that characterize the results of the enterprise for the reporting period based on data accounting. Therefore, reporting is the final stage in accounting.
Reporting plays a significant role in enterprise management. This is an important final stage in accounting. The content, frequency, deadlines for reporting are established by the relevant regulations based on the needs of taxation, management and operational management of the economy.
Reporting is used for the current management of the enterprise, its data is necessary for the analysis of production and financial activities. With its help, the causes of deviations from the specified parameters are revealed, unused production reserves are revealed. Annual reports production enterprises are widely used by statistical agencies for various developments, allowing to determine the direction and level of development of production.
Financial statements contain a system of indicators that characterize the financial and economic activities of the enterprise, thanks to an enlarged grouping of accounting objects by type corresponding to their economic content. Such groups of accounting objects constitute the elements of financial statements.
The main elements characterizing the composition of property and the sources of its formation, as well as directly related to the measurement financial position enterprises are its assets, liabilities and equity (liabilities). The elements that characterize the performance of the enterprise include profit and loss, and the elements that are directly related to the measurement of profit are income and expenses. When reporting, these elements are placed so that the resulting reporting information is suitable for users when making economic decisions. In this regard, all elements are reflected in the relevant forms of financial statements.
Balance sheet enterprises is a way of grouping and generalized reflection in monetary terms household funds enterprises by composition and location and by the sources of their formation on a certain date. (27, p. 85)
fixed assets and intangible assets reflect in the balance sheet at residual value; raw materials, basic and auxiliary materials, purchased semi-finished products, fuel, containers - according to actual cost; finished and shipped products, depending on the write-off procedure general expenses and using the account "40". Release of products, works, services - at full or incomplete actual cost and at full or incomplete standard cost products; settlements with debtors and creditors, each party reflects in its financial statements in amounts arising from accounting records and recognized as correct.
Accounts receivable that has expired limitation period, other debts that are unrealistic to collect are written off by decision of the head at the expense of the reserve doubtful debts or financial results. Writing off debt at a loss is not debt cancellation. It is reflected in the balance sheet for five years from the date of write-off to monitor the possibility of its recovery from the debtor. The amounts of accounts payable for which the limitation period has expired are written off to the financial results of the enterprise. In the event of the sale and other disposal of the property of the enterprise, the loss or income from these operations is attributed to financial results.
Profit and loss statement (form No. 2) contains in its sections information for the reporting and previous periods:
On profit (loss) from the sale of goods (products, works, services) - from the proceeds - net, the cost of goods sold is deducted by commercial and management expenses, if it is provided by the accounting policy;
About operating income and expenses with the allocation of interest receivable and payable;
On non-operating income and expenses and net ( retained earnings/ loss) of the reporting period.
The profit and loss statement is compiled mainly according to the data of accounts 90 "Sales" and 91 "Other income and expenses".
Statement of changes in equity (Form No. 3)- consists of four sections and help.
The first section "Capital" shows the balance at the beginning of the year, receipts, expenditure and balance at the end of the year of the components of equity capital.
In the second section "Reserves upcoming expenses"and in the third section" Estimated reserves"show the balances at the beginning and ends of the reporting period and the movement of the organization's reserves for future expenses and estimated reserves.
The fourth section "Changes in capital" contains information for the reporting and previous periods on the amount of capital at the beginning of the period, its increase, decrease and the amount of capital at the end of the reporting period.
Cash flow statement (Form No. 4) consists of four sections:
Cash balance at the beginning of the year;
Total cash received, including by types of receipts;
Total funds directed, including expenditure areas;
Cash balance at the end of the reporting year.
Cash flow is shown by type of activity - current, investment, financial.
Appendix to the balance sheet (form No. 5) consists of seven sections:
In the first section, "The movement of borrowed funds" shows the balances at the beginning and end of the reporting period, received and repaid debts, short-term loans and credits.
The second section "Accounts Receivable and Accounts Payable" contains data on the balances and movements for the year on short-term and long-term receivables with the allocation of overdue, as well as data on received and issued collateral.
The third section "Depreciable property" reflects the balances at the beginning of the reporting year and data on the receipt and disposal of each type of intangible assets and fixed assets and property for leasing and submitted under a rental agreement.
In the fourth section "Movement of funds long term investment and financial investments " contain information about own funds and attracted by their types.
The fifth section "Financial Investments" shows the amount of balances at the beginning and end of the reporting year for each type of long-term and short-term financial investments.
In the sixth section "Expenses for ordinary species activity" reflects the costs of the elements for the reporting and previous years and data on changes in the balance of work in progress, deferred expenses and reserves for future expenses.
The seventh section "Social indicators" provides data on contributions to state off-budget funds, information on insurance premiums due under the contracts voluntary insurance and others (27, p. 103)
Explanatory note to the annual financial statements should contain significant information about the organization, its financial position, comparability of data for the reporting and previous years, valuation methods and significant items of financial statements, changes in accounting policy organization, the composition of the members of the board of directors, members of the executive body and the amount of remuneration paid to them. It is advisable to include explanatory note data on the dynamics of the most important economic and financial indicators for a number of years, descriptions of future investments, ongoing economic activities and other information of interest to potential users of annual financial statements.
1.2 New approaches to the preparation of financial statements
Over the past years, work has been consistently carried out to form a system of Russian accounting standards and other documents on accounting and reporting, close to international standards financial statements (IFRS). Supplemented and changed the chart of accounts of financial accounting economic activity organizations and instructions for its use (order of the Ministry of Finance of the Russian Federation dated May 7, 2000 No. 38n). Innovations are due to the entry into force in 2003 of the following regulations:
PBU 17/02 "Accounting for the costs of research, development and technological work", approved by order of the Ministry of Finance of Russia dated November 19, 2002 No. 115n;
PBU 18/02 "Accounting for income tax settlements", approved by order of the Ministry of Finance of Russia dated November 19, 2002 No. 114n;
PBU 19/02 "Accounting for financial investments", approved by order of the Ministry of Finance of Russia dated 10.12.02 No. 126n;
Methodological guidelines for accounting of special tools, special devices, special equipment and special clothing, approved by order of the Ministry of Finance of Russia dated December 26, 2002 No. 135n.
According to the latest document, an enterprise can organize accounting for special tools, special fixtures, special equipment (hereinafter referred to as special equipment) either in a separate sub-account of account 10 “Materials”, or in the manner prescribed for accounting for fixed assets in accordance with PBU 6/01, approved by order Ministry of Finance of Russia dated 30.03.01 No. 26n.
When choosing in the accounting policy the organization accounting for these items according to the rules established Guidelines, to account 10 sub-accounts are opened: “Special equipment and special clothing in stock"; "Special equipment and special clothing in operation".
New accounts of the first order have been introduced: 09 “Deferred tax assets”, 77 “Delayed tax liabilities” (passive), and account 59 in section V “Cash” is now called “Provisions for the impairment of financial investments” (passive).
In accordance with the Order of the Ministry of Finance of the Russian Federation of July 22, 2003, they are recommended for use (starting from annual accounts for the period from January 1 to December 31, 2003) new samples of accounting reporting forms and approved in new edition instructions on the scope of these forms and on the procedure for compiling financial statements.
Nevertheless, they retain the foundations laid down in PBU 4/99, arising from the Federal Law “On Accounting”: the composition of financial statements, the procedure and deadlines for submission, General requirements to financial statements and evaluation of articles. As before, the organization receiving budget resources, as part of the financial statements, is obliged to provide reporting information on the nature of the use of budgetary funds.
The changes primarily relate to the components of financial statements themselves. In the balance sheet (Form No. 1), the number of articles has been drastically reduced. The previously available breakdowns of groups of articles are excluded, bearing in mind that they should be given in the explanatory notes to the Balance Sheet and Profit and Loss Statement, for example, in the Appendix to the Balance Sheet (Form No. 5). At the same time, the organization is not prohibited from presenting these transcripts directly in the balance sheet, if, in its opinion, this more clearly allows to present for interested users necessary information and enables better analysis of the data presented.
The main changes relate to the samples of two forms - the Statement of Changes in Equity (Form No. 3) and the Statement of Cash Flows (Form No. 4). Their formats are as close as possible to the recommendations given in IFRS.
The statement of changes in equity, instead of the traditional itemized presentation, has acquired a format that was first formatted in Russia for accounting purposes. The construction is based on reporting periods (previous and current).
Fundamentally new is the inclusion of indicators that affect the amount of formed retained earnings of the organization in the period between December 31 of the previous reporting year and January 1 of the current reporting year. The first indicator “Changes in accounting policy” is associated with the application of RAS 1/98 “Accounting policy of the organization”, when, when changing the accounting policy, its consequences outside the system affect account 84 “Retained earnings ( uncovered loss)". Another indicator “The result of the revaluation of fixed assets” follows from the exercise of the right of the organization to revaluate fixed assets in accordance with PBU 6/01 “Accounting for fixed assets”. (34, p. 113)
Attention is drawn to the fact that, in addition to the forms required in the financial statements, the organization can, as before, additionally develop new forms, bearing in mind the division of the Appendix to the Balance Sheet into several forms. In addition, instead of complicating the profit and loss statement, the organization has the right to display a number of indicators in a separate form (forms), for example, characterizing information on its segments (operational and geographical).
The organization should keep in mind that the financial statements should include indicators necessary to create a reliable and complete picture of the financial position of the organization, financial results its activities and changes in its financial situation.
One aspect of creating such a view is to make maximum use of the materiality requirement. The application of this requirement involves taking into account many factors. So it should be borne in mind that individual indicators that are not sufficiently significant for their separate view in the Balance Sheet and the Income Statement may be material enough to be presented separately in the notes to the Balance Sheet and the Income Statement (i.e. Statement of Changes in Equity, Statement of Cash Flows, Supplement to note).
An indicator is considered material if its non-disclosure may affect the economic decisions of interested users taken on the basis of reporting information. An entity's decision on materiality this indicator depends on the assessment of the indicator, its nature, the specific circumstances of occurrence. An entity may decide when an amount is considered material if it relates to the grand total of the relevant data for reporting year is at least five percent.
In addition to financial data, financial statements may contain other related information if the executive body considers it useful for interested users in making economic decisions. It recommends that you disclose:
The dynamics of the most important economic and financial indicators of the organization's activities over a number of years;
Planned development of the organization;
Estimated capital and long-term financial investments;
Lending policy, risk management;
Activities of the organization in the field of research and development work;
Environmental measures;
Other information.
Order of the Ministry of Finance of Russia dated July 22, 2003 No. 67n establishes that when forming financial statements indicators, one should be guided by the accounting provisions, of which nineteen were in force in 2003. Almost every PBU has special section“Disclosure of information in financial statements”, discloses issues related to the definition of a specific asset object, valuation (initial or actual, subsequent valuation, reserves, etc.), acceptance for accounting and disposal of property, liabilities, etc. In connection with this, there is no need to duplicate the existing instructions in a special (separate) document. At the same time, it was considered expedient to retain a number of rules that are absent in PBU and other accounting regulations.
A frequently encountered issue in accounting in organizations is the procedure for making corrections when accounting errors are detected and identified. The instructions repeat the previous procedure depending on the period of their discovery.
In cases where no correct reflection business transactions current period before the end of the reporting year, corrections are made by entries in the relevant accounting accounts in the month of the reporting period when the misstatements are revealed.
If it is found that the correct reflection of business transactions in the reporting year after its completion, but for which the annual financial statements are not approved in in due course, corrections are made by records of December of the year for which the annual financial statements are being prepared for approval and submission to the appropriate addresses.
If in the current reporting period an incorrect reflection of business transactions in the accounting accounts for the previous year is established, no corrections are made to the accounting records and financial statements for the previous reporting year (after the annual financial statements are approved in the prescribed manner).
The instructions provide one of the features of the formation of individual indicators in the financial statements of a non-profit organization.
Under civil law, commercial organization does not have the concept of capital and, therefore, when adopting the form of the Balance Sheet (form No. 1) in the section “Capital and Reserves”, there should be no groups of articles “Authorized capital”, “Reserve capital” and “Retained earnings (uncovered loss)”. (34, p. 176)
In the same time important place occupies an estimate of income and expenses, the movement of funds for which, in accordance with the Chart of Accounts for accounting for the financial and economic activities of the organization and the Instructions for its application, is reflected in account 86 “Target financing”. In this regard, in the section "Capital and reserves" of the balance sheet non-profit organization the group of articles "Target financing" should be included. For commercial organizations, as you know, the balances of funds in account 86 in the balance sheet are reflected in the group of articles "Deferred income". This is due to the fact that if a commercial organization receives funds free of charge (from the budget, from other organizations and persons), then in accordance with PBU 9/99 “Income of an organization”, donated assets form the financial result of the organization. At the same time, the procedure for the formation of the financial result is similar to the procedure set out in PBU 13/2000 “Accounting for State Assistance”.
An important issue in the formation of the Balance Sheet and the Profit and Loss Statement is the comparison of the indicators “Retained earnings (uncovered loss)” and “net profit”. In the Report, net profit is shown, as it were, in gross terms, and in the annual balance sheet, data on the groups of articles “Reserve capital”, “Retained earnings (covered loss)” are shown taking into account the consideration by the general meeting (meeting of participants, etc.) of the results of activities organizations for the reporting year, decisions taken on covering losses, paying dividends, etc. Therefore, there can be no equality of values for articles.
1.3 The financial statements of an enterprise as an information base for financial analysis
The subject of economic analysis are economic processes, in the aggregate, constituting the economic activity of the organization. Quantitative content and meaning business processes expressed in economic indicators, and the quantitative side financial processes enterprises - financial indicators. Most financial indicators are presented in the accounting (financial) statements.
Business entities in the territory of the Russian Federation conduct financial reporting, as we have already said, in accordance with the following documents: the Law of the Russian Federation on Accounting, the Regulation on Accounting and Accounting in the Russian Federation (approved by order of the Ministry of Finance of the Russian Federation of July 29, 1998 with subsequent additions No. 34n), "Accounting statements of the organization".
Reporting is the final element of the accounting system. All elements accounting report are interconnected and represent a system of economic indicators that characterize the conditions and results of the enterprise for the reporting period.
The main sources of information for financial analysis are the balance sheet (form No. 1), income statement (form No. 2), capital flow statement (form No. 3), cash flow statement (form No. 4), appendix to the accounting balance sheet (form No. 5), primary and analytical accounting data. (14, p.68)
In the Russian Federation, the asset balance is built in order of increasing liquidity of funds, i.e. in ascending order of the rate of transformation of these assets in the process of economic turnover into monetary form. Section 1 shows property that retains its original form almost until the end of its existence. Liquidity, i.e. the mobility of this property is the lowest. Section 2 of the asset balance shows such elements of the property of the enterprise, which during the reporting period repeatedly change their shape. The mobility of these balance elements is higher than the elements of section 1.
In the liabilities side of the balance sheet, the grouping of articles is given according to the legal basis. The entire set of obligations of the enterprise for the received values and resources is primarily divided by subjects: to the owners and to third parties (banks, creditors, etc.). (18, p. 74)
The obligations to the owners consist of two parts:
The capital that an enterprise receives from shareholders and shareholders at the time of the establishment of the enterprise and subsequently in the form of additional contributions from the outside;
The capital that an enterprise generates in the course of its activities, funding part of the profits received in the form of savings.
External liabilities of the enterprise is divided into long-term and short-term period. External liabilities are legal rights investors or lenders to the property of the firm. From an economic point of view, external liabilities are a source of formation of an enterprise's assets, and from a legal point of view, a company's debt to third parties.
Liability items are grouped according to the degree of urgency of repayment (repayment) of obligations in ascending order. The first place is occupied by the authorized capital as the most constant (permanent) part of the balance sheet.
The balance sheet makes it possible to assess the effectiveness of the enterprise's capital allocation, its sufficiency for current and future economic activities, to assess the structure and size of borrowed sources, as well as the effectiveness of their attraction.
Some of the most important balance sheet items are deciphered in the Appendix to the balance sheet (form No. 5), which consists of the following sections:
The movement of borrowed funds (long-term, short-term loans and loans) with the allocation of loans not repaid on time.
· Accounts receivable and accounts payable (long-term and short-term), as well as collateral (received and issued).
· Depreciable property: intangible assets, fixed assets.
· Movement of funds for financing long-term investments and financial investments.
Financial investments (long-term and short-term, shares and shares of other organizations, bonds and other securities provided loans, etc.).
· Costs incurred by the organization by item.
· Breakdown of individual profits and losses.
· Social indicators: average headcount personnel; contributions for social needs (to the Fund social insurance, in Pension Fund, to the Employment Fund; on the health insurance), cash payments and incentives, income from shares and deposits.
Certificate of availability of valuables accounted for on off-balance accounts:
Leased fixed assets;
Goods accepted for safekeeping;
Goods accepted for commission;
Depreciation of the housing stock;
Written-off debt of insolvent creditors.
Form No. 2 presents the components of balance sheet profit, net proceeds from the sale of products, goods, works, services; company's production costs products sold(works, services), commercial and administrative expenses, the amount of income tax and diverted funds, retained earnings.
These forms No. 5 and No. 2 are used to analyze the profitability of assets, sales, net profit, etc.
Form No. 3 "Capital flow statement" shows the structure of the company's own capital, presented in dynamics. For each element of equity, it reflects data on balances at the beginning of the year, replenishment of the source of equity, its expenditure at the beginning of the year.
Form No. 4 "Cash flow statement" reflects cash balances at the beginning of the year and the end of the reporting period and cash flows (receipts and expenditures) in the context of the current, investment and financial activities of the enterprise.
Forms No. 3 and No. 4 allow you to identify the factors that influenced the change in the financial stability and liquidity of the enterprise. (14, p. 131)
Even a cursory glance at the informational data of the financial statements shows significant analytical opportunities that can be effectively used in the management of the organization's capital, its assets and liabilities, income and expenses, and financial results.
To conduct a reasonable analysis and assessment of the financial position of an organization, one should use the entire arsenal of information flows about its economic activities, not limited to quarterly and annual financial statements, and it is also recommended to involve other information contained in:
Constituent documents of the organization;
Contracts and agreements for the supply of products and the acquisition of fixed assets and other property;
loan agreements;
Documents relating to the accounting policy of the organization;
General ledger and accounting registers (in particular, in magazines - orders, books of purchase and sales);
Tax declarations and certificates on the procedure for determining the data reflected in line 1 "Calculation of tax from actual profit".
In addition, data should be used statistical reporting, materials are also analyzed arbitration courts and claims, acts of inspections of the IMNS, audit reports.
I want to note that each source of information has a real productive opportunity to reveal quite fully and objectively certain aspects of the financial situation of an economic entity.
The choice of the depth and scope of the analysis of financial statements, as well as specific parameters and tools (set of methods) of analysis depends on the specific tasks that the user sets for himself in order to obtain the maximum possible, useful information for him.
1.4 Basic methods and techniques for analyzing accounting (financial) statements
The first group includes: the use of absolute, relative and average values; method of comparison, summary and grouping, method of chain substitutions.
Comparison technique consists in drawing up financial indicators of the reporting period with their planned values and with indicators of the previous period.
Receiving summaries and groupings consists in combining information materials into analytical tables.
Reception of chain substitutions is used to calculate the magnitude of the influence of factors in the overall complex of their impact on the level of the aggregate financial indicator. The essence of the methods of chain substitutions is that, successively replacing each reporting indicator with the base one, all other indicators are considered unchanged. This replacement allows you to determine the degree of influence of each factor on the total financial indicator.
The basic principle of analytical reading of financial statements is the deductive method, i.e. from the general to the particular, but it must be applied repeatedly. In the course of such an analysis, as it were, the historical and logical sequence of business operations, the direction and strength of their influence on the results of activities are reproduced.
· Horizontal (temporal) analysis - comparison of each reporting position with the previous period.
· Vertical (structural) analysis - determination of the structure of the final financial indicators with the identification of the impact of each reporting position on the result as a whole.
· Trend analysis - comparing each reporting position with a number of previous periods and determining the trend, i.e. the main dynamics of the indicator, cleared of random influences and individual characteristics individual periods. With the help of the trend, possible values of indicators in the future are formed, and a prospective analysis is carried out.
· Analysis of relative indicators (coefficients) - calculation of the ratios of reporting data, determination of the relationship of indicators.
· Comparative (spatial) analysis - this is both an on-farm comparison of individual indicators of a company, subsidiaries, branch offices, and an inter-farm comparison of the indicators of a given company with those of competitors, with average industry and average general economic data.
· Factor analysis is an analysis of the influence of individual factors (reasons) on the performance indicator using deterministic (functional) and stochastic (correlation) methods of research.
Factor analysis can be both direct and reverse, i.e. synthesis is the combination of individual elements into a common performance indicator. (21, p.37)
Many mathematical methods: correlation analysis, regression analysis, etc., entered the circle of analytical developments much later.
Methods of economic cybernetics and optimal programming, economic methods, methods of operations research and decision theory, of course, can be directly applied in the framework of financial analysis.
All of the above methods of analysis are formalized methods of analysis. However, there are also non-formalized methods: expert assessments, scenarios, psychological, morphological, etc., they are based on the description of analytical procedures at the logical level.
At present, it is practically impossible to isolate the techniques and methods of any science as inherent exclusively to it; and in financial analysis, various methods and techniques are used that were not previously used in it.
Financial ratios
The value of the abstract data of the balance sheet or income statement is very small, if they are considered in isolation from each other. Therefore, for an objective assessment of the financial situation, it is necessary to move on to certain value ratios of the main factors - financial indicators or ratios.
It is believed that if the level of actual financial ratios is worse than the comparison base, then this indicates the most painful places in the enterprise's activities that require additional analysis. True, an additional analysis may not confirm a negative assessment due to the specificity of specific conditions and features of the business policy of the enterprise. Financial ratios do not capture differences in accounting methods, do not reflect the quality of the constituent components. Finally, they are static in nature. It is necessary to understand the limitations that their use imposes and treat them as an analysis tool. (21, p. 109)
So, for a financial manager financial ratios are of particular importance, since they are the basis for evaluating its activities by external users of statements, shareholders and creditors. The targets of the financial analysis being carried out depend on who conducts it: managers, tax authorities, owners (shareholders) of the enterprise or its creditors.
It is important for the tax authority to answer the question of whether the enterprise is capable of paying taxes. Therefore, from the point of view of the tax authorities, the financial situation is characterized the following indicators:
– balance sheet profit;
– return on assets = book profit as a percentage of the value of assets;
- return on sales = balance sheet profit as a percentage of sales revenue.
Based on these indicators, the tax authorities can also determine the receipt of payments to the budget in the future.
Banks should receive an answer to the question about the solvency of the enterprise, that is, about its readiness to return borrowed funds.
Enterprise managers are primarily interested in resource efficiency and enterprise profitability.
The main indicators of this block of analysis include the return on advanced capital and the return on equity. When calculating, you can use either balance sheet profit or net income.
In this work, I will try to analyze the financial condition of the RMZ plant of the Uralasbest plant for 2005, according to Form No. 1 “Balance Sheet” and Form No. 2 “Profit and Loss Statement”.
2. ANALYSIS OF FINANCIAL STATEMENTS ON THE EXAMPLE OF PLANT "RMZ" COMBINE "URALASBEST"
2.1 Organizational and economic characteristics of the enterprise
Combine "Uralasbest" is an open joint stock company, which is reflected in its charter and company name. According to Article 2" Legal status joint-stock company" of the Federal Law "On Joint-Stock Companies", a joint-stock company, hereinafter referred to as a company, is a commercial organization, the authorized capital of which is divided into a certain number of shares, certifying compulsory rights participants of the company (shareholders) in relation to the company. Shareholders are not liable for the obligations of the company and bear the risk of losses associated with its activities, within the value of their shares. The Company is not liable for the obligations of its shareholders.
The company is a legal entity and owns separate property, accounted for on its independent balance sheet, may, on its own behalf, acquire and exercise property and personal non-property rights, bear obligations, be a plaintiff and defendant in court. Society has civil rights and bears the obligations necessary for the implementation of any types of activities not prohibited by federal laws.
Members of the company may alienate their shares without the consent of other shareholders. The company has the right to conduct an open subscription for shares issued by it and their free sale under the conditions established by law and other legal acts. JSC "Uralasbest" annually publishes for general information the annual report, balance sheet, income statement.
Society is considered to be created as entity since his state registration in the manner prescribed by federal laws. The company was created without limitation of validity period. The Company has a round seal containing its full corporate name in Russian and an indication of its location. The Company has stamps and letterheads with its name, its own emblem or logo, as well as a duly registered trademark and other means of visual identification.
JSC "Uralasbest" is registered by the Decree of the Mayor of Asbest, federal law dated December 26, 1995 No. 208-FZ "On Joint-Stock Companies".
Legal address of the company: 624060, Asbest , Sverdlovsk region, st. Uralskaya, 66.
The enterprise has settlement and other accounts in rubles in banking institutions.
The Company shall be liable for its obligations with all its property.
The company has issued registered shares. Shareholders are registered in the register of shareholders, which is maintained by the enterprise and an independent registrar in accordance with the regulations of the Russian Federation.
JSC "Uralasbest" independently plans its activities and determines the prospects for development, based on the demand for products, concluded contracts and the need to ensure production and social development enterprises, promotions personal income its employees and shareholders.
The charter of the company is the main constituent document of the company, in accordance with Article 11 of the Federal Law "On Joint Stock Companies". The requirements of the company's charter are binding on all bodies of the company and its shareholders.
The charter of the company contains the following information:
Full and abbreviated corporate name of the company;
Location of the company;
Type of company (open or closed);
Quantity, face value, categories (ordinary, preferred) shares and types preferred shares placed by the company;
Rights of shareholders - owners of shares of each category (type);
The size authorized capital society;
The structure and competence of the company's management bodies and the procedure for their decision-making;
The procedure for preparing and holding a general meeting of shareholders, including a list of issues on which decisions are made by the management bodies of the company by a qualified majority of votes or unanimously;
Information about branches and representative offices of the company;
Other provisions stipulated by the Federal Law "On Joint Stock Companies".
The main purpose of the enterprise is to meet the needs of organizations with its products and make a profit. The Company carries out the following activities:
Extraction, production, storage and sale of asbestos and asbestos products;
Trading activity;
Foreign economic activity;
Intermediary activity;
Investment activities.
The enterprise realizes the goals and performs the tasks related to its activities, directly or on the basis of agreements with enterprises and organizations in the manner prescribed by law.
JSC "Uralasbest" is the owner of:
Property, income received from the sale of its products, as well as other types of economic activity;
Fixed and current assets of the enterprise;
Income received from the sale of shares and other securities;
Income from securities of other enterprises;
Borrowed and credit funds;
Other property acquired on other grounds permitted by law.
JSC "Uralasbest" owns, uses and disposes of its property in accordance with its purpose. The Company writes off from its balance sheet fixed and current assets that have lost their production purpose. Profit or loss, as a result of the financial and economic activities of the enterprise, is allocated at the end of each quarter of the year. Balance sheet and net income are determined in the order provided by law. Balance profit is taxed in accordance with applicable law. Net profit The company formed after the payment of taxes remains at the disposal of the enterprise and, by decision of the general meeting of shareholders, is redistributed among the shareholders in the form of dividends and the formation of funds.
The company under consideration is the Repair and Mechanical Plant (Asbest, Zavodskaya St., 14) - is a structural unit joint stock company combine "Uralasbest".
This enterprise provides the repair base of the plant. In particular, the repair of excavators, electric locomotives, ground units and equipment used in the production of asbestos. The enterprise maintains an extensive lathe park, repair facilities and fixtures, welding equipment, a foundry, and more.
Structural subdivisions included in JSC "Uralasbest" have a complete balance sheet, accounting staff, positions of chief accountants, in independent workshops - leading accountants or accountants of the 1st category.
Responsibility for completeness, timeliness and quality accounting entries submitted reports is assigned to the chief accountants.
Deadline for submitting monthly financial statements to the accounting department for structural divisions established by the 10th day of the month following the reporting month.
All business transactions are documented by supporting documents. These documents serve as primary accounting documents on the basis of which accounting is maintained. Primary accounting documents are accepted for accounting if they are compiled in the form contained in the albums of unified forms of primary accounting documentation approved by the Decrees of the State Statistics Committee of the Russian Federation. Documents, the form of which is not provided for in these albums, contain the following details:
Title of the document;
The date the document was drawn up;
The name of the organization on behalf of which the document is drawn up;
Measures of business transactions in physical and monetary terms;
The name of the officials responsible for the business transaction and the correctness of its execution;
Personal signatures of the indicated persons.
Workflow schedule
Accounting for property and business transactions at the enterprise is carried out by the method double entry mechanized way using personal computers. Accounting records of property, liabilities and business transactions are kept in rubles and kopecks.
Accounting of property and business transactions is carried out in accordance with the Working Chart of Accounts and Sub-accounts of Accounting, developed in accordance with the Order of the Ministry of Finance of the Russian Federation dated October 31, 2002 No. 94n
A report on the availability and movement of fixed assets by type is compiled for 1 month. In him book value, depreciation and residual value by types of volumes of fixed assets.
A computer program for accounting is compiled by the programmers of the ACS center ( Automated System management).
From the annual financial statements of the RMZ plant - structural unit OJSC "Uralasbest" of the year of work, I chose the main economic indicators for the period 2005 and analyzed them.
2.2 Analysis of the dynamics and structure of the asset and liability balance
Drawing up analytical tables of assets and liabilities of the balance sheet
The stability of the financial position of the enterprise largely depends on the appropriateness and correctness of investing financial resources in assets. In the course of the functioning of the enterprise, both the value of assets and their structure undergo constant changes. The most general idea of the qualitative changes that have taken place in the structure of funds and their sources, as well as the dynamics of these changes, can be obtained using vertical and horizontal analysis of reporting.
Vertical analysis shows the structure of enterprise funds and their sources. There are two reasons for the need and expediency of such an analysis: on the one hand, the transition to relative indicators allows for inter-farm comparisons of the economic potential and performance of enterprises that differ in the amount of resources used and other volumetric indicators; on the other hand, relative indicators to a certain extent mitigate the negative impact of inflationary processes, which can significantly distort the absolute indicators of financial statements and thus make it difficult to compare them in dynamics. Vertical analysis can be subjected to either the original reporting or modified reporting (with an enlarged or transformed nomenclature of articles).
Horizontal analysis of reporting consists in building one or more analytical tables in which absolute indicators are supplemented by relative growth (decrease) rates. As a rule, basic growth rates are taken for adjacent periods (years), which makes it possible to analyze not only changes in individual indicators, but also to predict their values. The value of the results of horizontal analysis is significantly reduced in terms of inflation. However, these data can be used for cross-farm comparisons. horizontal and vertical analyzes complement each other, therefore, in practice, analytical tables are often built that characterize both the structure and the dynamics of individual indicators of the reporting accounting form. These types of analysis are valuable in inter-farm comparisons, because they allow you to compare the statements of enterprises that are completely different in terms of type of activity and production volumes.
To perform analytical studies and assess the structure of the asset and liabilities of the balance sheet, its articles are subject to grouping. The main features of the grouping of asset items are the degree of their liquidity (ie, the rate of transformation of their cash) and the direction of the use of assets in the economic activity of the enterprise. Depending on the degree of liquidity, assets are divided into two large groups: non-current (immobilized funds - less liquid) and current (mobile - more liquid). The analytical grouping of liabilities is based on the legal ownership of the funds used by the enterprise (own and borrowed) and the duration of their use in the enterprise's turnover.
Thus, with the analytical grouping of the balance sheet of the RMZ plant (Appendix 1), we obtain the following indicators:
ASSETS:
1. The total value of the property of the enterprise (or balance sheet currency).
At the beginning of the year = 20659.33 thousand rubles. At the end of the year = 132132.28 thousand rubles.
2. Cost of fixed assets and beyond current assets(immobilized assets), which is reflected as a result of the first section of the balance sheet asset.
At the beginning of the year = 6941.27 thousand rubles At the end of the year = 53122.86 thousand rubles
3. The cost of working mobile assets is the result of the second section of the asset balance.
At the beginning of the year = 13718.06 thousand rubles. At the end of the year = 79009.72 thousand rubles
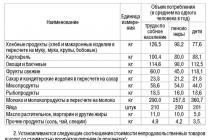
4. The cost of material circulating stocks is the sum of the cost of all stocks (including VAT) minus goods shipped.
At the beginning of the year = 5520.83 thousand rubles At the end of the year = 41248.62 thousand rubles
5. Amount of receivables, including advances given to suppliers and contractors.
At the beginning of the year = 7586.32 thousand rubles. At the end of the year = 26980.38 thousand rubles
6. The amount of free cash, including securities and short-term financial investments (bank asset).
At the beginning of the year = 610.91 thousand rubles. At the end of the year = 10780.42 thousand rubles
LIABILITY:
1. The cost of equity (sources of equity) is the result of the third section of the balance sheet liabilities, debts to participants (founders) for the payment of income and the item “Other short-term liabilities”.
At the beginning of the year = 8001.0 thousand rubles At the end of the year = 66890.5 thousand rubles
2. The amount of borrowed capital is the sum of the total of the fourth and fifth sections of the liability, minus the items included in equity.
At the beginning of the year = 12658.33 thousand rubles. At the end of the year = 65241.78 thousand rubles = 52583.45
3. The amount of long-term borrowed funds, i.e. the result of the fourth section of the liability balance. As a rule, they are directed to the formation of fixed assets of the enterprise.
At the beginning of the year = 7988.95 thousand rubles. At the end of the year = 33977.18 thousand rubles
4. Short-term credits and loans, which are, as a rule, the sources of the formation of working capital of the enterprise.
At the beginning of the year = 3881.85 thousand rubles At the end of the year = 11550.0 thousand rubles
5. Accounts payable.
At the beginning of the year = 787.53 thousand rubles. At the end of the year = 19714.6 thousand rubles
Analytical grouping of the balance sheet revealed a large increase in all items at the end of the year compared with the initial data. This is mainly caused rapidly inflation, which, to a greater or lesser extent, all balance sheet indicators are subject to.
An assessment of the dynamics of the composition and structure of the enterprise's property is carried out using analytical tables (Tables 1.1 and 1.2). In the analysis, it is necessary to take into account the influence of inflation, high level which leads to significant deviations of the nominal balance sheet data from the real ones. In Russian practice, inflationary processes are taken into account only when forming the cost of fixed assets. Therefore, when analyzing, it is necessary to determine the value of the increase in the value of these assets due to revaluation. To do this, you should additionally study the data of the relevant accounting registers. Revaluation of inventories, finished products in domestic practice is not produced, so the increase in their value is influenced by the inflationary factor.
Table 1.1
Analytical grouping of an asset
As can be seen from the table, at the end of the year there was an increase in all asset items.
The total value of the property increased by 111,472.95 thousand rubles. (i.e. by 539.6%). This was affected by a significant increase in the cost (by 46181.59 thousand rubles) and the share of fixed assets.
During the reporting year, the cost of working capital of the enterprise also increased by 65,291.66 thousand rubles, or by 475.9%. But their share in the total value of the property decreased and amounted to 59.796% at the end of the year. This is due to the lagging growth rates of mobile assets compared to the growth rates of all total assets.
The increase in current assets, in turn, was influenced by the increase in the cost inventories and the value of the banking asset and their share in the cost of working mobile funds, as well as an increase in accounts receivable by 255.6%.
In general, such a sharp increase in all indicators can be explained by very high inflation rates.
The reasons for an increase or decrease in the property of an enterprise can be identified by studying changes in the composition of the sources of its formation (Table 1.2).
Table 1.2
Analytical Grouping of Liabilities
The table shows that the increase in the value of property by 539% is mainly due to the growth of equity capital by 58889.5 thousand rubles, or by 736.03%; as well as an increase in borrowed capital by 415.4%.
2.3 Analysis of the company's own working capital
The most important step in the analysis of the financial condition is to determine the availability of own working capital and their safety.
The amount of own working capital is the difference between the total of the third section of the balance sheet liabilities and the total of the first section of the asset.
The analysis is carried out by comparing the amount of funds at the beginning and end of the year; the deviation is determined in monetary terms and as a percentage.
The change in the amount of working capital is directly proportional to all articles of the third section of the liability and inversely proportional to all the articles of the first section of the asset.
SOSnach = 8001-6941.27 = 1059.73 thousand rubles.
SOScon \u003d 66890.5-53122.86 \u003d 13767.64 thousand rubles.
DCOS=13767.64-1059.73=12707.91 thousand rubles
DCOS%= ![]() %
%
Table 2.1
Increase in own working capital at the end of the reporting period by 12,707.91 thousand rubles. occurred mainly due to an increase in the fund social sphere by 51916.45 thousand rubles, as well as due to the growth of additional capital. The change in the amount of working capital was inversely proportional to the change in the cost of fixed assets and construction in progress by 38,750.88 thousand rubles. and 7430.71 thousand rubles. respectively.
To check, we add all the sums, taking into account the signs, and as a result we get:
6973,05+51916,45+(-)38750,88+(-)7430,71=12707,91
12707.91=SOS=12707.91
2.4 Liquidity analysis of the balance sheet
Market economic conditions oblige the enterprise at any time to be able to urgently pay off external obligations.
A company is considered solvent if it total assets more than long-term and short-term liabilities. A company is liquid if its current assets are greater than its current liabilities.
The liquidity of the balance sheet means the degree of coverage of obligations by the enterprise with its assets, the period of conversion of which into cash coincides with the maturity of obligations under liabilities.
A1³P1, i.e. the most liquid assets (cash on hand, in accounts; short-term financial investments - lines 250 + 260) must be greater than or equal to the most urgent liabilities (accounts payable - line 620),
A2³P2, i.e. fast-moving assets (accounts receivable for which payments are expected within 12 months after the reporting date - line 240) - greater than or equal to short-term liabilities ( short-term loans and loans - p.610+ p.660).
A3³P3, i.e. slow-moving assets (stocks and costs of section 2, excluding deferred expenses line 210 + line 220 + line 230 + line 270) - greater than or equal long-term liabilities (long-term loans and loans-line 590+line 630+line 640+line 650).
A4 £ P4, i.e. hard-to-sell assets ( fixed assets minus investments in subsidiaries and affiliates - p. 190) must be less than or equal to permanent liabilities (sources of own funds - p. 490-p. 390).
In the event that one or more conditions are not met, the liquidity of the balance sheet to a greater or lesser extent differs from the absolute one. At the same time, the lack of funds in one group is compensated by their excess in another.
Table 3.1 reflects the dynamics of the corresponding groupings of assets and liabilities more clearly.
Table 3.1
Balance liquidity analysis
1. Absolute liquidity ratio The balance sheet shows what part of the short-term debt the company can repay in the near future. It is equal to:
=![]()
=![]()
The value of the coefficient is considered sufficient if it is from 0.2 to 0.5. That is, if an enterprise can currently pay off all its debts by 20%, then its solvency is considered normal.
At the analyzed enterprise, at the beginning of the year, the absolute liquidity ratio was below the norm, by the end of the year it increased and amounted to 0.34, which is within the normative range. This suggests that at the end of the reporting year, the company can cover the available bank asset most of the most urgent obligations and short-term liabilities.
2.Current liquidity ratio shows what part of the current liabilities for loans and settlements can be repaid by mobilizing all the working capital of the enterprise.
This indicator is calculated as the ratio of all current assets to the value of term liabilities.
![]()
=![]()
Satisfying is usually a value greater than or equal to 2.
Thus, at the beginning of the year, the value of the coefficient met the standard (2.94). At the end of the year, the current liquidity ratio decreased to 2.52
3.Coefficient of critical evaluation is equal to the ratio of liquid funds of the first two groups to the total amount of short-term debts of the enterprise. It reflects that part of short-term liabilities that can be repaid out of cash (in cash, on a current account, short-term securities), as well as through settlement proceeds, i.e. it shows the solvency of the enterprise for a period equal to the duration of one turnover of receivables. The permissible value of this indicator is 1.5. However, if a large proportion of liquid funds is accounts receivable, some of which is difficult to collect in a timely manner, a larger ratio is required. If a significant share of current assets is occupied by cash and cash equivalents, then this ratio may be smaller.
![]()
![]()
It can be seen from the calculations that the value of this coefficient increased slightly by the end of the year, but, nevertheless, is at an unsatisfactory level.
2.5 Market sustainability analysis
1.autonomy factor, which is calculated as the ratio of the value of sources of own funds to the balance sheet total.

This coefficient shows the share of own funds in the total amount of all funds of the enterprise advanced by it for the implementation of statutory activities.
It is believed that the higher the share of equity capital, the more chances the company has to cope with unforeseen circumstances that arise in a market economy.
The minimum threshold value of the autonomy coefficient is estimated at 0.5. That is, if this coefficient is greater than or equal to 0.5, then the company can cover its obligations with its own own funds. The calculation of this coefficient, illustrating the growth, indicates an increase financial independence reducing the risk of financial difficulties in the future.
In our example, the autonomy coefficient at the end of the year increased and amounted to 0.51, i.e. corresponds to the critical value. Thus, at the analyzed enterprise, there is an increase in its financial independence, and from the point of view of creditors, it increases the guarantee of its obligations by this enterprise.
The coefficient of autonomy is complemented
2. debt to equity ratio , equal to the ratio of the value of the enterprise's obligations on borrowed funds to the amount of own funds.

This ratio indicates how much borrowed funds the company has attracted for 1 rub. own funds invested in assets. A value less than or equal to 1 is considered normal. At the same time, it should be taken into account that the ratio of borrowed and own funds is the most unstable of all indicators of financial stability. Therefore, for the calculation it is necessary to determine the turnover of inventories and receivables, tk. with high turnover, this ratio can significantly exceed the standard.
An important characteristic of financial stability is also
3.agility factor, equal to the ratio of the company's own working capital to the sum of the sources of own funds.

This ratio shows what part of own funds is in mobile form allowing relatively free manipulation. As optimal value the maneuverability coefficient can be taken as greater than or equal to 0.5. This means that it is necessary to comply with the parity principle of investing in assets of a mobile and immobile nature, which will ensure sufficient liquidity of the balance sheet.
At the analyzed enterprise, the maneuverability coefficient at the beginning and end of the year is below the standard value (0.13 and 0.2, respectively), which indicates a lack of own working capital for maneuvering.
Also exists
4. coefficient of maneuverability of functioning capital, which is found as A3 / (A1 + A2 + A3) - (P1 + P2).
The decrease in this indicator in dynamics is a positive factor, because the coefficient shows what part of the functioning capital is immobilized in production stocks and long-term receivables.

The coefficient of maneuverability of functioning capital at the analyzed enterprise decreased by 0.02 by the end of the year, which indicates a slight decrease in the share of immobilized capital.
5. The share of working capital in assets most often depends on the nature of production and the industry of the enterprise and is determined by the formula:

Thus, the share of working capital in the assets of this enterprise has decreased. But due to insufficient data, it is difficult to say how this change affected the overall state of the organization.
One of the main indicators of enterprise sustainability is
6. Equity ratio , which must be at least 0.1
![]()

7. Index of stocks and costs own sources their formation .
It is equal to the ratio of the amount of own funds of the enterprise to the value of inventories and costs.
Share of own funds in stocks and costs
![]()

The normal value of this indicator varies from 0.6 to 0.8.
In our example, the share of own funds in stocks and costs is below the norm both at the beginning and at the end of the year. This indicates the negative impact of this indicator on the financial stability of the enterprise.
An important characteristic of the structure of enterprise funds is given by
8.Property ratio industrial purpose , equal to the ratio of the amount of fixed assets, capital investments, inventories and work in progress to the value of all property of the enterprise.

The normative value of the coefficient is greater than or equal to 0.5. If the coefficient is below the norm, then it is advisable for the enterprise to attract long-term borrowed funds to increase the property for production purposes. The parity principle of investing in the property of the production sector and the sphere of circulation creates favorable conditions, both for creating production potential and for financial stability.
At this enterprise, the coefficient of industrial property was 0.52 and 0.64 at the beginning and end of the year, respectively, which satisfies the standard condition.
Along with the indicators characterizing the structure of the enterprise's property, it is necessary to calculate and analyze the coefficients showing the share of short-term and long-term debt in the sources of the enterprise's funds. These are the ratios:
9.Long-term leverage ratio is determined by the ratio of the amount of long-term loans and borrowings to the total amount of sources of own and borrowed funds. This coefficient makes it possible to roughly estimate the share of borrowed funds in financing capital investments.

10. Short-term debt ratio characterizes the share of short-term liabilities of the enterprise in the total amount of external liabilities and is equal to the ratio of short-term debt to the amount of long-term loans, short-term loans, accounts payable.

11. Coefficient of autonomy of sources of formation of reserves and costs shows the share of own working capital in the total amount of the main sources of formation of stocks and costs.

12. Ratio of accounts payable and other liabilities characterizes the share of accounts payable and other liabilities in the total amount of the company's liabilities.

The decrease in long-term (from 0.39 to 0.26) debt ratios indicates that by the end of the year the enterprise became more independent in financially. But by the end of the year, the share of accounts payable in the total amount of liabilities increased, which may raise doubts about the solvency of this enterprise. At the same time, there was some increase in the penultimate coefficient, which indicates an increase in the share of own funds in the total amount of sources of reserves and costs.
13 .Financial stability ratio - part of the asset financed from sustainable sources.
k financial stability-beginning year\u003d (cost of equity + amount of long-term borrowed funds) / total balance
k financial stability-beginning = (8001+7988,95) / 20659,33= 0.77
k financial.sustainability-end.year = (66890,5+33977,18) / 132132,28= 0.76
14. Assessment of the degree of satisfaction with the balance structure is carried out on the basis of the following indicators:
- current liquidity ratio;
- coefficient of provision with own funds.
The last coefficient is calculated as the ratio of the amount of own funds of the enterprise to the amount of current assets, i.e.

The basis for recognizing the balance sheet structure as unsatisfactory, and the enterprise as insolvent is the presence of one of the following situations:
1) the current liquidity ratio at the end of the reporting period has a value less than 2;
2) the coefficient of provision with own funds at the end of the reporting period has a value less than 0.1.
The system of criteria for assessing the structure of the balance sheet includes the coefficient of restoration (loss) of solvency, which characterizes the presence of a real opportunity for the enterprise to restore (or lose) its solvency after a certain period of time.
14.1. Solvency recovery ratio is calculated if at least one of the above coefficients is below the standard value. It is determined for a period equal to 6 months, according to the formula:
T – reporting period, months;
Ktec/norm is the normative value of the current liquidity ratio equal to 2.
![]()
The recovery coefficient, which takes a value greater than 1, indicates the presence of a real opportunity for the enterprise to restore its solvency within six months.
In the event that the actual level of these coefficients at the end of the reporting period is equal to or higher than the standard values, but there is a tendency to reduce them, then
14.2. Loss of solvency ratio for a period of 3 months, according to the following formula:
![]()
If the solvency loss ratio is greater than 1, then the company has a real opportunity to maintain its solvency for three months, and vice versa.
Thus, the current liquidity ratio decreased, and at the end of the year its value was 2.52, which still satisfies the norm. The value of the coefficient of provision with own funds at the beginning and end of the year corresponds to the standard (more than 0.1). The recovery factor is higher than 1, so this enterprise has real opportunity restore their solvency within the next six months.
Various liquidity indicators not only characterize the stability of the financial condition of an enterprise with a different degree of accounting for liquid funds, but also meet different interests. external users information.
For example: for suppliers of raw materials and materials, the absolute liquidity ratio is most interesting; the bank issuing a loan to this organization will be more interested in the critical liquidity ratio; buyers and shareholders of the company assess the financial condition of the current liquidity ratio.
2.6 Analysis of solvency, potential bankruptcy and determination of the type of financial stability of the enterprise
One of the goals of financial analysis is the timely detection of signs of bankruptcy of an enterprise . It is primarily associated with the insolvency of the enterprise.
In accordance with the legislation in force in Russia, the basis for declaring an enterprise bankrupt is their failure to fulfill their obligations to pay for goods, works, services after three months from the date of payment. In a relationship state enterprises In addition, there is a procedure approved by the Decree of the Government of the Russian Federation, according to which they are subject to the Bankruptcy Law if they have an unsatisfactory balance sheet structure. (23, p. 86)
To determine the quantitative parameters of the financial condition of the enterprise and identify signs of bankruptcy, immediately after drawing up the next balance sheet, calculate and analyze the ratio various indicators. There are several methods of analysis:
I Way
Absolute liquidity ratio
Critical Appraisal Coefficient
Current liquidity ratio
Autonomy coefficient
Equity ratio
Financial stability ratio
After calculating all the above indicators, the second stage is carried out comprehensive assessment the financial condition of the enterprise according to the following principle.
Table No. 4
Indicator ratings
Classification based on the results of the analysis is carried out at the third stage.
1. 97-100 points - an organization with absolute financial stability and absolute solvency. Basically, these are profitable enterprises, with a rational structure of capital and property.
2. 67-96 - a normal financial condition, close to optimal, and the company has a chance to move to the 1st class, they are quite profitable.
3. 37-66 - average financial condition, weakness of individual financial indicators, financial stability - normal, solvency - problematic, at the border of the permissible, i.e. the enterprise is able to fulfill obligations, but will not necessarily do it on time.
4. 11-36 - unstable financial condition, solvency at the lower acceptable limit, since the capital structure of the enterprise is unsatisfactory, profit is insignificant in absolute terms.
5. 0-10 - the crisis financial condition of the organization, practically insolvent, financially unstable, unprofitable, on the verge of bankruptcy. (23, p. 201)
Depending on the class, it becomes clear which part of the balance needs to be considered and what problems need to be addressed. This method is more commonly used in Russia.
Moreover, the Government of the Russian Federation determines the following coefficients and their acceptable levels
· Current liquidity ratio, Kt.l.(L4)>=2;
· SOS security factor, Ko.(V3)>=0.1;
· Coefficient of recovery (loss) of solvency, Kv.p.>=2
And if the enterprise, after the balance sheet, these indicators are below the established ones, then this enterprise falls under the Bankruptcy Law.
So, based on the indicators of the coefficients calculated in the previous chapters, we determine which class our enterprise belongs to:
Table 5
In accordance with the results obtained, it can be concluded that at the beginning of the year the enterprise belonged to the 4th group, i.e. to enterprises with an unstable financial condition: solvency is at the lower acceptable limit, since the capital structure of the enterprise is unsatisfactory, profit is insignificant in absolute terms. But during the year, measures were taken to improve the financial condition and by the end of the year the enterprise can be attributed to the following group: an enterprise with an average financial condition, the weakness of certain financial indicators, financial stability is normal, solvency is problematic, at the border of the permissible, i.e. the enterprise is able to fulfill obligations, but will not necessarily do it on time.
Now it is necessary to identify the problematic parts of the balance, i.e. shortcomings in the capital structure.
In order for the enterprise to move to at least the second class, it is necessary to score at least 15 more points, i.e., for the K of the critical assessment and the K of the SOS security to take values equal to 10 (as one of the options).
1. Since K critical evaluation = (A1 + A2) / (P1 + P2), then
the following conclusions can be drawn:
The company has a clear lack of funds and this is due, first of all, to a very high accounts receivable, which is much higher than creditor. In this regard, it is necessary to change the policy in relation to debtors.
· If the company is not a supporter of such measures, then another way is possible - reducing the funds frozen in stocks. And here the problem of overstocking is obvious, that is, sales channels are still poorly established, since the enterprise is young. Plus, it is necessary to re-calculate the norms for: raw materials and materials, work in progress.
2. Since K SOS = (P4-A4) / (A1 + A2 + A3), it should be noted that:
· The main problem is the lack of reserve capital as such, as well as the accumulation fund. The solution to this problem is such that with an increase in profits, of course, the opportunities for creating these funds and reserves will increase, but we should not forget that completely directing the money earned to consumption (working capital), and not to accumulation, may not have a favorable effect on the future development of the enterprise. .
By law RF needs to calculate the following indicators.
· Current liquidity ratio, K t.l.>=2; we have 2.54
· SOS security factor, K o.s.s>=0.1; we have 0.17
· Coefficient of recovery (loss) of solvency, Kv.p.>=2; we have 2.7
Thus, in accordance with Russian Legislation the company can be considered solvent.
II Way
The ratio of SOS to the amount of the Asset (X1),
X1=COS/p.300
The ratio of retained earnings to the sum of all assets (X2),
X2=Unprofitable/p.300;
The ratio of earnings before interest and taxes to the sum of all assets
X3=Profit before taxes/pg.300;
Attitude market value ordinary and preferred shares to borrowed capital (X4),
X4=R. Art. shares/lines 590+690;
The ratio of sales to the sum of all assets (X5),
X5=V sales/page 300
At the second stage, E. Altman's Z-score formula is used:
Z-score=1.2X1+1.4X2+3.3X3+0.6X4+1X5 (23, p.106)
Table 6
Bankruptcy Probabilities
Calculate the probability of bankruptcy using the Z-score formula. Altman:
Z-score=1.2*0.67+1.4*0+3.3*0.74+0.6*0+1*2.5=0.804+2.442+2.5=5.746
Table 8
So, we can conclude that bankruptcy in the near future does not threaten the enterprise, but, in my opinion, in order to further reduce its likelihood and thereby improve the financial condition, it is necessary:
First, it is necessary to change the policy of spending profits and use it not only for consumption, but also to create various funds (accumulation), thus increasing the X2 indicator.
Secondly, as one of the ways to increase equity capital, the issue and placement of shares, preferably among the employees of the enterprise, can act. But in this case, one should not forget about the costs associated with their release, and the payment of future dividends to shareholders.
Also, to obtain additional information about the financial condition of the enterprise, a classification can be carried out in order to identify the type of financial stability of the organization based on the sources of cost coverage used by it.
There is a close relationship between the assets and liabilities of the balance sheet. Each item of the asset balance has its own source of funding. The source of financing for long-term assets is equity and long-term borrowings. Cases of formation of long-term assets at the expense of short-term bank loans are not exceptional. Current assets are formed both at the expense of own capital and at the expense of short-term borrowed funds. It is desirable that half of the funds be formed at the expense of own and half - at the expense of borrowed capital. Then the guarantee of repayment of external debt is provided.
Depending on the sources of formation, the total amount of current assets (working capital) is usually divided into two parts: the variable part, which is created at the expense of short-term liabilities of the enterprise; a constant minimum of current assets (stocks and costs), which is formed at the expense of permanent (own and long-term borrowed) capital. The lack of own working capital leads to an increase in the variable and a decrease in the constant part of current assets, which indicates an increase in financial dependence enterprise and the precariousness of his position. (21, p.36)
A general indicator of liquidity is the sufficiency (surplus or shortage) of sources of funds for the formation of reserves.
To characterize the sources of formation of reserves and costs, several indicators are used that reflect different kinds sources; they are calculated on the basis of the balance sheet data:
1. Availability of own working capital (SOS)
2. The presence of own and long-term borrowed sources of formation of reserves and costs or the availability of functioning capital (FC)
3. The total value of the main sources of formation of reserves and costs (JVI)
Three indicators of the availability of sources of formation of reserves and costs correspond to indicators of the availability of reserves and costs by sources of formation:
1. Surplus (+) or deficiency (-) SOS:
B1 \u003d SOS - Total inventory and costs
2. Surplus (+) or deficiency (-) of FC:
B2 \u003d FC - The total amount of reserves and costs
3. Surplus (+) or deficiency (-) JVI:
B3 \u003d VI - The total amount of reserves and costs
With the help of these indicators, it is possible to determine a three-dimensional indicator of the type of financial stability (U). U=1 if B>0 and U=0 if B<0. Далее с его помощью выделяют четыре типа финансовой ситуации:
Table 9
4 types of financial stability of the organization
| Type of financial stability | Three dimensional indicator | Use of cost recovery sources | a brief description of |
| Abs. fin. stability |
B1>0,B2>0,B3>0 |
Own turnover. funds | They do not depend on creditors and have high solvency |
| Norm. fin. stability |
B1<0,B2>0,B3>0 |
Own turnover. funds + long-term loans | The enterprise has normal solvency, efficient use of borrowed funds, high yield production activities |
| Unstable fin. condition |
B1<0,B2<0,B3>0 |
SOS + DC + short-term loans | The enterprise has a violation of solvency, attraction of additional sources of financing, the situation can be improved |
| Crisis fin. condition |
B1<0,B2<0,B3<0 |
Insolvent bankruptcy |
Let's determine the type of financial stability of the enterprise in accordance with the three-dimensional indicator:
Table 10
Indicators for determining the type of financial stability
| Financial indicators | For the beginning of the year | At the end of the year |
| 1 Sources of own funds (art. 490) | 8001 | 66890,5 |
| 2 Fixed assets and other non-current assets (Article 190) | 6941,27 | 53122,86 |
3 Availability of own working capital (Art. 490-190) |
1059,73 | 13767,64 |
| 4 Long-term loans and borrowings (art. 590) | 7988,95 | 33977,18 |
5 Availability of own and long-term borrowed sources for the formation of reserves and costs (clause 3+clause 4) |
9048,68 | 47744,82 |
| 6 Short-term loans and borrowings (art. 610) | 3780 | 11550 |
7 The total value of the main sources of formation of reserves and costs (clause 5 + clause 6) |
12828,68 | 59294,82 |
| 8 Total inventory and costs (item 210) | 5488,91 | 40888,19 |
9 Surplus (+) or shortage (-) of own working capital (clause 3-clause 8) |
-4429,18 | -27120,55 |
10 Surplus (+) or shortage (-) of own and long-term borrowed sources of formation of reserves and costs (clause 5-clause 8) |
||
11 Surplus (+) or shortage (-) of the total value of the main sources of formation of reserves and costs (clause 7-clause 8) |
The table shows that B1<0; B2>0; B3>0 , which means that the three-dimensional indicator is 011 - the company has normal financial stability.
So, from our analysis of the financial statements of the enterprise, we found that at the end of the year there was an increase in all asset items. (table 1.1)
The total value of the property increased by 111,472.95 thousand rubles. (i.e. by 539.58%). This was affected by a significant increase in the cost (by 46181.59 thousand rubles). During the reporting year, the cost of working capital of the enterprise also increased by 65,291.66 thousand rubles, or by 475.95%. But their share in the total value of the property decreased and amounted to 59.798% at the end of the year. This is due to the lagging growth rates of mobile assets compared to the growth rates of all total assets.
The increase in current assets, in turn, was influenced by the growth in the cost of inventories and the value of the banking asset, as well as an increase in receivables by 255.6%.
In general, such a sharp increase in all indicators can be explained by high inflation rates.
Table 1.2 shows that the increase in the value of property by 539.58% is mainly due to an increase in equity capital by 58889.5 thousand rubles, or by 736.03%; as well as an increase in borrowed capital by 52583.45 thousand rubles. or by 415.41%. Increase in own working capital at the end of the reporting period by 12,707.91 thousand rubles. occurred mainly due to an increase in the fund of the social sphere by 51916.45 thousand rubles, as well as due to the growth of additional capital by 6973.05 thousand rubles. The change in the amount of working capital was inversely proportional to the change in the value of fixed assets and construction in progress by 38,750.88 thousand rubles. and 7430.71 thousand rubles. respectively.
Liquidity analysis of the balance sheet showed that:
According to Table 3.1, liquidity deviates from absolute liquidity at the beginning and end of the year due to the lack of bank assets to cover current liabilities and the absence of short-term receivables.
At the analyzed enterprise, at the beginning of the year, the absolute liquidity ratio was below the norm, by the end of the year it increased and amounted to 0.34, which is within the normative range. This suggests that at the end of the reporting year, the company can cover most of its short-term liabilities with its bank assets.
At the beginning and end of the year, the value of the current liquidity ratio met the standard. This means that the company is able to cover its urgent obligations with working capital. But the coefficient of critical assessment is at an unsatisfactory level, which can cause difficulties both with obtaining a loan and with its return.
The conducted assessment of market stability gave the following results:
At this enterprise, there is a significant increase in its financial independence, and from the point of view of creditors, it increases the guarantee by this enterprise of its obligations.
The calculation of the ratio of borrowed and own funds of this enterprise at the end of the year (Ksot / q.g. = 0.97, which satisfies the regulatory conditions) confirms the growth of its financial independence due to the excess of the growth rate of own funds over the growth rate of borrowed capital.
The maneuverability coefficient increased, but did not reach the recommended optimal value, which is explained by the insufficiency of the enterprise's own working capital, which are in a mobile form, and the restriction of freedom in maneuvering these funds.
The equity ratio increased from 0.1 to 0.17, but, nevertheless, it is below the normal value, which indicates the insufficient financial stability of the enterprise.
The share of own funds in stocks and costs also increased, but did not reach the normal value. This can be explained by the diversion of own funds from current assets (since the share of current assets in assets has decreased) or, which confirms the coefficient of maneuverability of functioning capital, the freezing of funds in stocks and costs.
The decline in long-term (from 0.39 to 0.26) debt ratios indicates that by the end of the year the company has become more financially independent. This also confirms a certain increase in the coefficient of autonomy of the sources of formation of reserves and costs (from 0.13 to 0.2). But by the end of the year, the share of accounts payable in the total amount of liabilities increased, which may raise doubts about the solvency of this enterprise.
The above calculations of the criterion coefficients (current liquidity, equity and solvency recovery ratio) and analysis of their dynamics give grounds to recognize the balance sheet structure as satisfactory, and the enterprise as solvent.
According to the results of the analysis of the financial condition of the enterprise, it can be concluded that the analyzed enterprise has an average financial condition, the weakness of certain financial indicators, financial stability is normal, solvency is problematic, at the border of the permissible, i.e. the enterprise is able to fulfill obligations, but will not necessarily do it on time.
To stabilize the work of the enterprise, he needs to: increase the share of his own working capital in a mobile form, change the credit policy in relation to debtors, reduce the funds frozen in stocks.
An analysis of the probability of potential bankruptcy showed that in the near future the enterprise does not threaten, but in order to further reduce its probability and thereby improve the financial condition, it is necessary to change the policy of spending profits and use it not only for consumption, but also to create various funds (accumulation) .
The results of the analysis carried out are somewhat contradictory. This is due, first of all, to the lack of data presented, as well as high inflation rates, which, of course, distort the real state of the enterprise at the moment.
CONCLUSION
So, the object of our study was the analysis of financial statements.
The subject is the analysis of the financial statements of the RMZ plant of the Uralasbest plant. The purpose of the work was to study the principles and methods of analyzing the financial statements of an enterprise and developing conclusions and practical recommendations on this basis.
In the first chapter of the work, we present the studied theoretical material on the analysis of financial statements: the economic essence of the analysis, the characteristics and composition of financial statements are disclosed, and the methods of financial analysis are considered.
Reporting is the final stage in accounting. Financial statements contain a system of indicators characterizing the financial and economic activities of the enterprise, thanks to the enlarged grouping of accounting objects by type, corresponding to their economic content.
Over the past years, work has been consistently carried out to form a system of Russian accounting standards and other accounting and reporting documents that are close to International Financial Reporting Standards (IFRS). The chart of accounts for financial and economic activities of organizations and instructions for its application were supplemented and amended (Order of the Ministry of Finance of the Russian Federation dated May 7, 2000 No. 38n). Innovations are due to the entry into force in 2003 of new regulations.
Accounting (financial) statements serve as the basis for analyzing the financial position of the enterprise.
The purpose of financial analysis is to evaluate the information contained in the statements, compare existing information and create new information based on them, which will serve as the basis for making certain decisions.
The main sources of information for financial analysis are the balance sheet (form No. 1), income statement (form No. 2), capital flow statement (form No. 3), cash flow statement (form No. 4), appendix to the accounting balance sheet (form No. 5), primary and analytical accounting data.
Form No. 1 is the most informative form for analyzing and assessing the financial condition. The balance reflects the state of property, equity and liabilities of the enterprise on a certain date.
The main indicators of balance sheet analysis are: indicators of financial stability, profitability, turnover, liquidity of the enterprise.
In the process of financial analysis, a number of special methods and techniques are used. Ways of applying financial analysis can be divided into two groups: traditional and mathematical.
The basic principle of analytical reading of financial statements is the deductive method, i.e. from the general to the particular, but it must be applied repeatedly.
The practice of financial analysis has developed the following basic methods for reading financial statements:
1. Horizontal (temporal) analysis - comparison of each reporting position with the previous period.
2. Vertical (structural) analysis - determination of the structure of the final financial indicators with the identification of the impact of each reporting position on the result as a whole.
3. Trend analysis - comparing each reporting position with a number of previous periods and determining the trend, i.e. the main dynamics of the indicator.
3. Analysis of relative indicators (coefficients) - calculation of the ratios of reporting data, determination of the relationship of indicators.
5. Comparative (spatial) analysis.
6. Factor analysis is an analysis of the influence of individual factors (reasons) on the performance indicator using deterministic (functional) and stochastic (correlation) research methods.
All of the above methods of analysis are formalized methods of analysis.
Financial ratios characterize the proportions between various reporting items. The advantages of financial ratios are the simplicity of calculations and the elimination of the influence of inflation.
The second chapter is devoted to the analysis of the financial performance of the RMZ plant of the Uralasbest plant on the basis of form No. 1 “Balance sheet”.
We have given the organizational - economic characteristics of the enterprise; to analyze the dynamics and structure of the assets and liabilities of the balance sheet, own working capital of the enterprise, analysis of the liquidity of the balance sheet, analysis of market stability and solvency;
The most general idea of the qualitative changes that have taken place in the structure of funds and their sources, as well as the dynamics of these changes, can be obtained using vertical and horizontal analysis of reporting.
Vertical analysis shows the structure of enterprise funds and their sources.
Horizontal analysis of reporting consists in building one or more analytical tables in which absolute indicators are supplemented by relative growth (decrease) rates. Horizontal and vertical analyzes complement each other, therefore, in practice, analytical tables are often built that characterize both the structure and the dynamics of individual indicators of the reporting accounting form.
The analytical grouping of liabilities is based on the legal ownership of the funds used by the enterprise (own and borrowed) and the duration of their use in the enterprise's turnover.
Assessment of the dynamics of the composition and structure of the property of the enterprise is carried out using analytical tables.
We have carried out an analytical grouping of an asset and an analytical grouping of a liability.
The most important step in the analysis of the financial condition is to determine the availability of own working capital and their safety. The analysis is carried out by comparing the amount of funds at the beginning and end of the year; the deviation is determined in monetary terms and as a percentage.
A company is liquid if its current assets are greater than its current liabilities.
In domestic practice, the analysis of the solvency and liquidity of an enterprise is carried out by comparing the funds for an asset, grouped by the degree of their liquidity and arranged in descending order of liquidity, with liabilities for liabilities, grouped by their maturity and arranged in ascending order of terms. In essence, the liquidity of an enterprise means the liquidity of its balance sheet.
For analysis, the asset and liability are divided into 4 groups. In an asset, depending on the timing of their conversion into cash, in liabilities, depending on the maturity of liabilities.
When analyzing the current financial condition of the enterprise, relative indicators are also used:
1. The absolute liquidity ratio of the balance sheet shows what part of the short-term debt the company can repay in the near future.
2. The current liquidity ratio shows what part of the current liabilities for loans and settlements can be repaid by mobilizing all the working capital of the enterprise.
3. The coefficient of critical assessment is equal to the ratio of liquid funds of the first two groups to the total amount of short-term debts of the enterprise. it shows the solvency of the enterprise for a period equal to the duration of one turnover of receivables.
In a market economy, the financial independence of the enterprise from external borrowed sources is of great importance. The stock of sources of own funds is a stock of financial stability of the enterprise, provided that its own funds exceed borrowed ones.
One of the most important indicators characterizing the financial stability of an enterprise, its independence from borrowed funds, is:
The autonomy coefficient, which is calculated as the ratio of the value of sources of own funds to the balance sheet total.
The autonomy coefficient is complemented by the ratio of borrowed and own funds.
An important characteristic of the stability of the financial condition is also the coefficient of maneuverability, equal to the ratio of the enterprise's own working capital to the sum of its own sources of funds.
There are also other coefficients, such as: the coefficient of maneuverability of functioning capital, the share of working capital in assets, the ratio of own funds, the indicator of the provision of reserves and costs with their own sources of their formation, the share of own funds in reserves and costs, the coefficient of industrial property, the coefficient long-term borrowing, short-term debt ratio, autonomy ratio of sources of reserves and costs, accounts payable and other liabilities ratio, financial stability ratio - part of the asset financed from sustainable sources.
Assessment of the degree of satisfaction with the balance sheet structure is carried out on the basis of the following indicators:
current liquidity ratio;
Equity ratio.
One of the goals of financial analysis is the timely detection of signs of bankruptcy of the enterprise. To do this, an analysis of solvency, potential bankruptcy and determination of the type of financial stability of the enterprise is carried out.
From our analysis of the financial statements of the RMZ plant of the Uralasbest plant, we made conclusions and recommendations, which are set out in a separate chapter.
Drawing conclusions about the work done, it should be noted that a well-conducted analysis makes it possible to identify and eliminate shortcomings in financial activity and find reserves for improving the financial condition of the enterprise and its solvency; predict financial results based on real business conditions.
LIST OF USED LITERATURE
1. Civil Code of the Russian Federation. Part 1 and part 2;
3. Federal Law No. 129-FZ “On Accounting”, approved by the President of the Russian Federation on November 21, 1996
4. Order of the Ministry of Taxes of the Russian Federation dated February 26, 2002 No. BG-3-02 / 98 “On approval of methodological recommendations for the application of Chapter 25 “Corporate income tax” of the 2nd part of the Tax Code of the Russian Federation;
5. Order of the Ministry of Finance of the Russian Federation dated June 28, 2000 No. 60n “On approval of methodological recommendations on the procedure for compiling the financial statements of an organization”;
6. Order of the Ministry of Finance of the Russian Federation dated January 13, 2000 No. 4n “On the forms of financial statements of an organization”.
7. PBU 18/02 “Accounting for income tax settlements”, approved by order of the Ministry of Finance of Russia dated November 19, 2002 No. 114n;
8. PBU 19/02 "Accounting for financial investments", approved by order of the Ministry of Finance of Russia dated December 10, 2002 No. 126n;
9. Regulations on accounting and financial reporting in the Russian Federation (approved by Order of the Ministry of Finance of the Russian Federation of December 9, 1998 No. 60n (as amended by Order of the Ministry of Finance of the Russian Federation of December 30, 1999 No. 107n);
10. Accounting regulation 9/99 “Income of the organization” (approved by Order of the Ministry of Finance of the Russian Federation of 06.05.1999 No. 32n (as amended by Orders of the Ministry of Finance of the Russian Federation of 30.12.1999 No. 107n, of 30.03.2001 No. 27n))
11. Accounting regulation 10/99 "Expenses of the organization" (approved by the Order of the Ministry of Finance of the Russian Federation of 06.05.1999 No. 33n (as amended by the Orders of the Ministry of Finance of the Russian Federation of 12.30.1999 No. 107n, of 30.03.2001 No. 27n))
12. Chart of accounts for accounting of the financial and economic activities of the enterprise and instructions for its use (approved by order of the Ministry of Finance of the Russian Federation dated October 31, 2000 No. 94n
13. Baryshnikov N.P. Accounting, reporting and taxation. M.: INFRA-M, 2003, 452 p.
14. Burstein L.A. Analysis of financial statements. - M.: F. and St., 1996.
15. Berdnikova T.B. Analysis and diagnostics of financial and economic activity of the enterprise. Moscow: INFRA-M, 2002.
16. Borodina E. I. Finance of enterprises - Moscow, publishing house "UNITI", 2001, 228 p.
17. Borisov L.P. Evaluation of the results of the financial and economic activities of the enterprise / Consultant, No. 8, 2000. P. 71-75
18. Vakulenko T.G., Fomina L.F. "Analysis of accounting (financial) statements for making management decisions" - St. Petersburg: "Gerda Publishing House", 2001
19. Gilyarovskaya L.T. Economic analysis. Tutorial. M.: Unity, 2003, 312s
20. Dontsova L.V., Nikiforova N.A. Comprehensive analysis of financial statements. M.: Business and Service, 2001, 516 p.
21. Dontsova L.V., Nikiforova N.A. Analysis of financial statements.-M.: DIS, 1998.
22. Efimova O.V. Analysis of the economic activity of the enterprise. Moscow: Unity, 2002, 318 p.
23. Efimova O.V. The financial analysis. - M.: Accounting, 1996.
24. Zimin N.E. Analysis and diagnostics of the financial condition of enterprises: Textbook. - M.: ICF "EKMOS", 2002. -240 p.
25. Kovalev V.V. Financial analysis: Money management. Choice of investments. Reporting analysis.-M.: F. and St., 2000.
26. Markaryan E.A., Gerasimenko G.P. The financial analysis. Moscow: Prior, 1997.
27. Novodvorsky V.D. Accounting statements of the organization. M.: Accounting, 2002, 115 p.
28. Negashev E.V., Sheremet A.D. Theory of economic analysis. - M., "Finance and statistics" 2003, 305 p.
29. Selezneva N.N. Financial analysis: Proc. allowance / N.N. Selezneva, A.F. Ionova. – M.: UNITI-DANA, 2001.-479s.
30. Sheremet A.D., Seyfulin R.S. Methods of financial analysis. – M.: 2002-365s.
31. Sheremet A.D. Methods of financial analysis: Proc. and pract. allowance for universities / A.D. Sheremet, R.S. Saifulin, E.V. Negashev. - 3rd ed. revised and add.-M.: INFRA-M, 2003.-207p. - (Higher education).
32. Shishkin A. K., Vartanyan S. S. Accounting and financial analysis for commercial enterprises. - M .: "Infra - M" 2001, 401 p.
33. Financial analysis of the company's activities. - M., "East-Service", 2002, 201 p.
34. Accounting: compilation and analysis / Ed. Novodvorsky V.D. -M.: IMPRES, 2004.-213p.
35. Accounting analysis / Ed. Goldberga M.A. Kyiv.: 2003.-117 p.
36. Legal reference system "Garant"
37. http://www.finanalis.ru/litra/finanalis/?leaf=dvdensr.htm
ATTACHMENT 1
BALANCE SHEET
Form N 1 according to OKUD
Date (year, month, day)
Organization ___________________________________________ according to OKPO
Taxpayer Identification Number__________________TIN
Type of activity ______________________________________ according to OKDP
Organizational and legal form / form _______________________
property _________________________________________________
according to OKOPF / OKFS
____________________________________________________________
Unit of measurement: thousand rubles / million rubles according to OKEI 384/385
Address _______________________________________________________
Approval date
Date of dispatch (acceptance)
| ASSETS | Line code | Back to top reporting period |
reporting period |
| 1 | 2 | 3 | 4 |
| I. NON-CURRENT ASSETS | |||
| Intangible assets (04, 05) | 110 | ||
including: patents, licenses, trademarks (service marks), other rights and assets similar to those listed above |
111 | ||
| organizational expenses | 112 | ||
| business reputation of the organization | 113 | ||
| Fixed assets (01, 02, 03) | 120 | 5160,4 | 439110,28 |
including: land plots and objects of nature management |
121 | ||
| buildings, machinery and equipment | 122 | ||
| Construction in progress (07, 08, 16, 61) | 130 | 1780,87 | 9211,58 |
| Profitable investments in material assets (03) | 135 | ||
including: property for leasing |
136 | ||
| rental property | 137 | ||
| Long-term financial investments (06, 82) | 140 | ||
including: investments in subsidiaries |
141 | ||
| investments in dependent companies | 142 | ||
| investments in other organizations | 143 | ||
| loans granted to organizations for a period of more than 12 months | 144 | ||
| other long-term financial investments | 145 | ||
| Other noncurrent assets | 150 | ||
| TOTAL for section I | 190 | 6941,27 | 53122,86 |
| II. CURRENT ASSETS | |||
| Stocks | 210 | 5488,91 | 40888,19 |
including: raw materials, materials and other similar values (10, 12, 13, 16) |
211 | 2436,56 | 14562,17 |
| animals for growing and fattening (11) | 212 | ||
| costs in work in progress (distribution costs) (20, 21, 23, 29, 30, 36, 44) | 213 | 1574,72 | 11427,36 |
| finished goods and goods for resale (16, 40, 41) | 214 | 1477,63 | 14898,66 |
| goods shipped (45) | 215 | ||
| prepaid expenses (31) | 216 | ||
| other inventories and expenses | 217 | ||
| Value added tax on acquired valuables (19) | 220 | 31,92 | 360,43 |
| Accounts receivable (for which payments are expected more than 12 months after the reporting date) | 230 | 7586,32 | 26980,38 |
including: |
231 | 6032,88 | 18593,4 |
| bills receivable (62) | 232 | ||
| 233 | |||
| advances issued (61) | 234 | ||
| other debtors | 235 | 1553,44 | 8386,98 |
| Accounts receivable (for which payments are expected within 12 months after the reporting date) | 240 | ||
including: buyers and customers (62, 76, 82) |
241 | ||
| bills receivable (62) | 242 | ||
| debt of subsidiaries and affiliates (78) | 243 | ||
| debt of participants (founders) on contributions to the authorized capital (75) | 244 | ||
| advances issued (61) | 245 | ||
| other debtors | 246 | ||
| Short-term financial investments (56, 58, 82) | 250 | ||
including: loans granted to organizations for a period of less than 12 months |
251 | ||
| own shares repurchased from shareholders | 252 | ||
| other short-term financial investments | 253 | ||
| Cash | 260 | 610,91 | 10780,42 |
including: |
260 | 181,46 | 10718,47 |
| current accounts (51) | 262 | ||
| currency accounts (52) | 263 | ||
| other cash (55, 56, 57) | 264 | 429,45 | 61,95 |
| Other current assets | 270 | ||
| TOTAL for Section II | 290 | 13718,06 | 79009,72 |
| BALANCE (sum of lines 190 + 290) | 300 | 20659,33 | 132132,28 |
| LIABILITY | At the beginning of the reporting period | At the end of the reporting period | |
| 1 | 2 | 3 | 4 |
| III. CAPITAL AND RESERVES | |||
| Authorized capital (85) | 410 | 6245,4 | 6245,4 |
| Additional capital (87) | 420 | - | 6973,05 |
| Reserve capital (86) | 430 | ||
including: reserves formed in accordance with the law |
431 | ||
| reserves formed in accordance with constituent documents | 432 | ||
| Social Sphere Fund (88) | 440 | 1517,25 | 53433,7 |
| Earmarked funding and income (96) | 450 | ||
| Retained earnings of previous years (88) | 460 | ||
| Uncovered loss of previous years (88) | 465 | ||
| Retained earnings of the reporting year (88) | 470 | X | |
| Uncovered loss of the reporting year (88) | 475 | X | |
| TOTAL for Section III | 490 | 8001,0 | 66890,5 |
| IV. LONG TERM DUTIES | |||
| Loans and credits (92, 95) | 510 | 7988,95 | 33977,18 |
including: bank loans maturing more than 12 months after the reporting date |
511 | 7988,95 | 33977,18 |
| loans maturing more than 12 months after the reporting date | 512 | ||
| Other long-term liabilities | 520 | ||
| TOTAL for section IV | 590 | 7988,95 | 33977,18 |
| V. SHORT-TERM LIABILITIES | |||
| Loans and credits (90, 94) | 610 | 3780,00 | 11550,0 |
including: bank loans maturing within 12 months after the reporting date |
611 | 3780,0 | 11550,0 |
| loans maturing within 12 months after the reporting date | 612 | ||
| Accounts payable | 620 | 787,53 | 19714,6 |
including: suppliers and contractors (60, 76) |
621 | - | 5589,15 |
| bills payable (60) | 622 | ||
| debt to subsidiaries and affiliates (78) | 623 | ||
| debt to the organization's personnel (70) | 624 | 387,48 | 145,75 |
| debt to state off-budget funds (69) | 625 | 116,55 | 1186,5 |
| debt to the budget (68) | 626 | 103,95 | 9982,35 |
| advances received (64) | 627 | ||
| other creditors | 628 | 179,55 | 2810,85 |
| Debts to participants (founders) on payment of income (75) | 630 | ||
| Deferred income (83) | 640 | ||
| Reserves for future expenses (89) | 650 | ||
| Other current liabilities | 660 | 101,85 | 0 |
| TOTAL for section V | 690 | 4669,38 | 31264,6 |
| BALANCE (sum of lines 490 + 590 +690) | 700 | 20659,33 | 132132,28 |
APPENDIX 2
CERTIFICATE ON THE AVAILABILITY OF VALUES ACCOUNTED ON OFF-BALANCE ACCOUNTS
| Name of indicator | Line code | At the beginning of the reporting period | At the end of the reporting period |
| 1 | 2 | 3 | 4 |
| Leased fixed assets (001) | 910 | ||
| including leasing | 911 | ||
| Inventory assets accepted for safekeeping (002) | 920 | ||
| Goods accepted for commission (004) | 930 | ||
| Written-off debt of insolvent debtors (007) | 940 | ||
| Collateral for obligations and payments received (008) | 950 | ||
| Security for obligations and payments issued (009) | 960 | ||
| Depreciation of housing stock (014) | 970 | ||
| Depreciation of objects of external improvement and other similar objects (015) | 980 | ||
| 990 |
Supervisor _________ ____________
Chief Accountant _________ ____________
(signature) (signature transcript)
"__" ________________ ____ (professional accountant qualification certificate)
from "__" ________ ____ g. N ______)
The essence and objectives of the analysis of the financial statements of the organization
Definition 1
Analysis of financial statements enterprise is an important part of financial analysis, which is associated with research on the current financial condition and financial results of the company.
This is the most important tool for detecting shortcomings and problems in managing the financial and economic activities of an enterprise, forecasting individual indicators, and also for choosing promising areas for investment.
The main objectives of the financial analysis of the enterprise imply the need to solve a number of the following tasks:
- assessment of the property status of the organization
- liquidity and solvency assessment
- financial stability assessment
- analysis of financial results
- business activity analysis
- comprehensive assessment of the financial condition of the enterprise
- recommendations for improving financial results, etc.
Sources of information for financial analysis
Remark 1
The main source of information for financial analysis is the organization's financial (accounting) statements. At the same time, the most important information can be obtained from such sources for analysis as:
- Balance sheet (form No. 1)
- Profit and loss statement (Form No. 2).
Balance sheet characterizes the financial position of the enterprise as of a certain date (in monetary terms). The assets of the balance sheet are built in ascending order of the liquidity of the organization's property. Liquidity is the ability to quickly convert assets into cash.
Report about incomes and material losses It is also the most important source of information for the purposes of financial analysis. Through the use of this reporting form, you can explore:
- profitability indicators of the enterprise (in general)
- profitability of production
- determine the amount of net profit and other important indicators.
Individual accounting statements performs two main functions:
- informational
- control.
On the one hand, individual financial statements characterize the financial result of activities and the current financial position of a business entity.
On the other hand, individual financial statements provide systematic control over the accuracy and correctness of accounting data at the end of each of the accounting cycles.
Consolidated financial statements is designed to provide interested users with access to comparable, high-quality and guaranteed information about a group of business entities. To effectively solve this problem, it is necessary to prepare consolidated financial statements in accordance with International Financial Reporting Standards (IFRS).
Management reporting intended for use in the management of an organization. It reflects the main processes that were carried out in the organization in the reporting period and its main purpose is to provide the owners and management of the company with reliable information about the state of affairs in the company
Tax reporting intended, in general, for fiscal purposes. It is compiled on the basis of information that is formed in accounting, by adjusting it in accordance with the norms of tax legislation.
The results of the analysis of financial statements are issued, as a rule, in the form of an analytical note, which includes the following main sections:
- general information about the organization
- financial and other data used in the analysis, ratios and other analytical indicators
- assessment of positive and negative factors in the most important areas of analysis
- conclusions and assessments based on the results obtained
- building predictive models (based on analysis), etc.
All decisions of an economic nature are made based on the results of financial analysis. That is why the analysis of financial statements must be reliable.
Analysis of the financial statements of the enterprise
The analysis of financial statements is carried out to obtain the necessary and informative indicators, on the basis of which it is possible to objectively and clearly assess the financial condition of the company and what results it has already managed to achieve. The main goal of this work is achieved by specialists when they solve a certain list of analytical tasks.
What is an analytical task? This is a specification of the purpose of the study, which takes into account its organizational, informational, technical and methodological capabilities. The objectives of the analysis of financial statements are different, but the main one is to reveal and understand the key causes of factors that have a greater impact on the financial position of the company at the moment.
The analysis of financial statements is carried out in order to:
- objectively assess the financial position of the company;
- identify the factors and causes that contributed to the achievement of the goals and the current situation of the enterprise;
- prepare and justify the management decisions that are related to financial activities;
- take timely measures to improve solvency;
- ensure the development of financial rehabilitation plans;
- identify and mobilize reserves to improve the financial situation and increase the efficiency of the enterprise.
Economic analysis of financial statements is an integral part of the company's financial activities. Such a study provides good opportunities for:
- identifying reserves to improve the financial situation;
- an objective assessment of the level of efficiency of the use of different sources of financial resources;
- timely adoption of measures to improve the solvency, liquidity and financial stability of the organization;
- providing a prepared information base for current and strategic financial management activities;
- ensuring optimal production and social development of the team through the use of reserves identified through the analysis.
Why analyze the financial statements of competitors
Olga Morozova, financial director of LogLab logistics company
Based on the annual reports of the largest enterprises, you can objectively assess the state of affairs of competitors and see the specifics of their activities from the inside. This is without exaggeration a unique opportunity. However, you need not just to get acquainted with the reports, but to delve into them, analyze them.
Let's take a step-by-step look at what parameters should be given special attention in the analysis of financial statements and how to use the data obtained when making decisions.
Thanks to the results of analyzing the financial statements of enterprises operating in your field, you can better assess your own strengths and weaknesses, and understand what trends are emerging in your industry.
There are a number of specific reasons why you should analyze the financial statements of competing companies:
- A great chance to get acquainted with the best practices. Reports always consist of sections that provide a detailed description of organizational, macroeconomic risks and difficulties of enterprises. Also from the reports you can learn how to solve various kinds of problems. With the valuable insights you gain, you can create the perfect business model to make operations, investments, and finance faster and more efficient.
- This is a good opportunity to get to know the players in your market better. After analyzing the financial statements, you will understand what goals a particular company that is of particular interest to you has set for itself, and what results it has managed to achieve today.
- Convenient access to information. You can familiarize yourself with the annual reports at any time convenient for you - they are posted on the websites of organizations. For financial directors who are constantly short of time, this is a great solution.
That is, thanks to the study of annual reports, you can get acquainted with the practical activities of enterprises, analyze their business cases and see competitors from the inside.
Financial Statement Analysis Methods
Horizontal and vertical
Analysis of financial statements in a company can be horizontal and vertical. If you use these methods when checking reports, then you can certainly strengthen your financial position faster and more efficiently by increasing capital.
When articles are combined and supplemented with data on the structure and dynamics for the reporting period, comparative analytical balances appear that are subject to detailed study.
Balance sheet items are classified depending on the purpose of the analysis. Be sure to take into account the specifics of the company and many other indicators. Assets are often grouped according to the level of liquidity.
If a horizontal analysis of financial statements is carried out, it compares the totals with data from past periods. Particular attention in the study is paid to sudden changes in parameters in dynamics and the fluctuations of different reporting articles are compared.
The meaning of the analysis is that the data in the reports are placed on the main items at the beginning and end of the period. Next, the absolute indicator of deviations is calculated for each balance sheet item. Then they evaluate what changes (in percentage) have occurred for all items separately.
The purpose of the analysis of vertical type financial statements is to determine the structure of the balance sheet and reporting on financial results and see how these indicators develop. The scheme is as follows: the total amount of assets and revenue of the enterprise is taken as 100%. Each section of the financial report is a percentage of the accepted base values.
factorial
As part of factor analysis, comparable values are compared. Comparison with this method is:
- planned and actual;
- normative and actual;
- for previous and current time periods;
- comparison of industry averages with the analyzed enterprise data.
Experts evaluate the dynamics of indicators, determine the degree of implementation of the plan, conduct inter-farm comparisons, establish the level of influence of various factors on the activities of the enterprise and develop solutions to improve the financial situation.
In the study, comparable indicators are compared. It is also very important to carry out modeling, in which mathematical equations are compiled using analyzed and factorial values.
As part of the analysis, the following types of models are used:
- deterministic
- functional,
- stochastic,
- correlation.
And apply the following methods:
- chain substitution;
- index methods;
- absolute difference;
- relative difference.
Express option
Any analysis of financial statements consists of several stages and necessarily includes a preliminary or express analysis of financial statements. The purpose of this study is to quickly and easily assess the financial position and dynamics of the company.
Express analysis of financial statements consists of 3 stages, these are:
- preparation;
- view ;
- economic reading and analysis of financial statements.
First of all, they determine whether it is advisable to analyze the statements, and establish how the company is ready to study them.
When checking the readiness of reports for reading, look at:
- availability of all forms, signatures, details, applications;
- correct completion of reporting forms.
The second stage is the study of the annual accounts and explanatory notes. Experts evaluate the working conditions for the period of the report and identify what qualitative changes have occurred in the state of the enterprise.
The third stage is the auditor's assessment of the results and financial condition of the company.
Express analysis of financial statements is carried out in order to highlight several significant and easy-to-calculate parameters and track their dynamics.
Such selection is subjective. Express analysis of the accounting financial statements of the enterprise is internal. It is carried out before a deeper check.
Analysis of consolidated reports
An external user regards the consolidated financial statements as additional information to eliminate the limitations of the private balance sheet. For parent companies, the analysis of consolidated reports is an extension and addition to reporting.
When analyzing financial statements, remember that in order to prevent repeated accounts and artificial overstatement of capital and financial results, it is necessary to eliminate some items in internal operations.
Items that should be excluded from the consolidated financial statements are as follows:
- debt on a contribution not made to the authorized capital;
- received and paid advances;
- group loans;
- mutual receivables and payables;
- costs and profits in the coming period;
- unexpected operations.
In this case, the following methods are used:
- vertical analysis of financial statements;
- analysis of relative indicators;
- comparison method.
The methodology and sequence of actions in the analysis of consolidated balance sheets is similar to the actions within the framework of a regular balance sheet.
They explain what types of consolidation were used, how the companies were combined into a group, and how the members of such a group are related to each other.
Note that they analyze not only consolidated reports, but also the financial statements of parent companies and subsidiaries. Determine the proportion of parent and subsidiaries in the property of the group, and also evaluate the share of the subsidiary in its assets.
By performing the analysis, the experts determine and evaluate the share of the subsidiary in the financial result of the financial industrial group.
Express analysis is convenient in conditions of limited time and information
Elena Dmitrieva, financial director of TK GARD LLC
Express analysis of financial statements is carried out if the company has little time for research and not much primary data. Despite the fact that any financial statements have certain limitations, in this case, only information from form No. 1 (balance sheet) and form No. 2 (profit and loss statement) of financial statements are often available.
Financial statements are analyzed to determine how risky it is to work with a particular enterprise if it is included in the group, to assess the usefulness of accounting information and to understand what conclusions can be drawn about the company based on information from these data forms.
|
Section/article |
||
|
Number increase |
Decreasing the number |
|
|
Fixed assets |
In all likelihood, this indicates that the company has acquired property or invested in construction. If any of the articles in this section increases markedly, you should immediately pay attention to the articles of liabilities and determine at what expense the company made investments. It can be own or borrowed, long-term or short-term funds. |
Such a trend may indicate both the sale of fixed assets and the accrual of depreciation, that is, the physical deterioration / obsolescence of fixed assets of production. |
|
If non-current assets include construction in progress, it should be understood that this property will retain its value only if the company continues to invest in construction. In the event of investment freezes due to the crisis, the real price of these assets will be significantly lower than the book value. |
||
|
current assets. Stocks |
A large volume and an annual increase in stocks may indicate overstocking. |
If inventories are steadily decreasing, then most likely the company has reduced business activity, that is, curtailed activities, or it does not have enough working capital to purchase the required amount of inventory. |
|
In the second section of the balance sheet, attention should be paid to such an item as VAT on acquired valuables. If there is a large amount of this tax, which continues to grow, we can say that the company has certain reasons to reduce tax payments (non-submission of VAT for reimbursement from the budget). This situation may be caused by the fact that the document flow at the enterprise is organized unsatisfactorily, the quality of tax accounting can be called low, or the company purchases goods (products) at an inflated cost or from unreliable suppliers. If this is the case, we can confidently speak of high tax risks at the enterprise. |
||
|
Accounts receivable. This balance sheet item should ideally be considered together with the revenue figure from Form 2. |
If accounts receivable increase due to the fact that sales are growing, we can say for sure: the company's revenue began to increase due to a change in the organization's credit policy. That is, the company has increased the term of the commodity credit. If, however, an increase in receivables reduces revenue, this may indicate that a change in credit policy in a favorable direction for customers did not help the company retain its customers. That is, its operational risks have increased. |
If accounts receivable decrease and revenue increase, the following conclusion suggests itself: the company's customers began to pay their bills earlier, that is, the number of days of delay was reduced, or prepayment began to act for the settlement of some goods (and buyers perceived this as a change in the company's credit policy). If the organization's revenue has decreased, then, consequently, customer debt has also decreased. |
|
Accounts receivable may also consist of advances paid in connection with the construction or purchase of property, plant and equipment. That is, in the future, such debt should be converted either into fixed assets or into construction in progress, but not into money. |
||
|
Cash. |
Both the increase and decrease in the figure for this item prevent us from reaching any meaningful conclusion. |
|
|
Let's move on to the second section of our balance sheet. The most impressive amount is allocated to stocks - they have grown in price. Since we cannot say for sure whether there is a positive or negative trend here, we should further analyze the indicators for this article, that is, conduct a vertical analysis and calculate the turnover ratio. The amount of value added tax claimed for deduction by the end of the year amounted to more than 17 million rubles. Compared to last year, it has grown, which means that the enterprise has tax risks. The amount of receivables increased against the backdrop of a decrease in revenue. It is necessary to analyze the indicators for this article. |
||
|
Capital and reserves. Authorized capital |
Usually, changes under this article occur only if the organization was re-registered due to an increase / decrease in the authorized capital for one reason or another (including a change in ownership). |
|
|
Retained earnings (uncovered loss) |
At this stage of the analysis, the existence of the amount under this article is considered. If there is a loss, the article is classified as problematic. To perform a more detailed analysis, there are few indicators reflected in the balance sheet. |
|
|
Credits and loans |
Based on the balance sheet, we can judge whether the company has short-term or long-term loans, whether they have increased or decreased in size. It is impossible to understand at this stage whether it is reasonable to attract credit resources in a particular case and how effective they are due to the lack of sufficient information. |
|
|
Accounts payable. We analyze by type of debt. |
If accounts payable to suppliers have increased, this may indicate both a delay in payments, that is, that the company has violated its payment obligations, and that there are agreements to increase the delay, subject to the same volumes of purchases, timely payment, good relationships. If the amount of tax debt has increased, then, most likely, the tax risks for the organization have increased. |
A decrease in the amount of accounts payable may indicate either a tightening of the credit policy of suppliers, or an early fulfillment by the company of its payment obligations. If the debt on tax payments decreases, we can talk about both the timeliness of the fulfillment of tax obligations, and less taxation as a result of a decrease in business activity. |
Based on the balance sheet data, you can estimate in advance how solvent the company is at the date of the report. Here it is necessary to compare the cost of working capital and the amount of short-term liabilities. The result is the "margin of safety" of the company in terms of solvency.
3 tricks in the analysis of accounting and financial statements
Groupings. A qualitative analysis of the company's financial statements involves the use of this technique. Thanks to him, it is possible to better understand what the essence of the studied factors and processes is, to systematize analytical materials, to identify and put to work the reserves for improving the efficiency of the enterprise.
Often they use a grouping by sections in a business plan - by technical, technological factors, by organizing the production and management process, by financial and economic conditions. Groupings are especially important if you analyze consolidated reports, because in this case, thanks to them, it is possible to identify lagging economic entities and activate hidden resources to increase the efficiency of their work.
Isolation of bottlenecks. Highlighting possible problematic points in the analysis of financial statements, specialists identify areas or types of resources that hinder the successful development of the company, as well as reserves that are crucial for improving performance. If the bottlenecks are studied first of all, then the analysis of financial statements becomes more efficient and operational, and the experts manage to come to more objective conclusions. In addition, labor costs are reduced, which is also important.
It is necessary not only to analyze the bottlenecks, but also to understand what links make production activities more efficient. We can talk, for example, about the timely commissioning of new capacities, the flow of raw materials to the enterprise and the attraction of labor.
The method of identifying bottlenecks can be effectively used in the analysis and comparison of reporting of actual units of production (business units).
Balance reception. Most often, as part of the analysis of financial statements, they use the balance sheet method. It becomes even more effective when the movement of stocks, funds, receivables and payables is examined, the balances at the end of the year are determined taking into account the balances at the beginning of the year, and the receipts and write-offs of reserves are estimated during the year. In addition, the balance method is used as an auxiliary technique to check the calculations performed by other specialists using other types of analysis (factorial method, chain substitution method, etc.).
Analysis of financial statements indicators using ratios
The analysis of financial statements can be carried out not only by the horizontal and vertical methods. Often, a number of calculated indicators - coefficients are used.
There are various ratios that can be used to analyze financial statements. Below, we'll take a look at the most important metrics and group them into 5 main categories. The coefficients are presented in a simplified form for more convenient and easy perception.
Liquidity ratios.
The liquidity of an enterprise is its ability to meet short-term financial obligations. When analyzing liquidity, the most easily marketable assets that can be quickly converted into financial assets are compared with the organization's short-term liabilities.
Generally speaking, the more short-term liabilities are covered by liquid assets, the better for the company. If there is a low level of provision with liquid assets, it can be assumed that it will be difficult for the organization to meet its short-term financial obligations, which means that it will be difficult for the organization to conduct current operations.
During a crisis for business or the economy, an enterprise with insufficient liquidity may be forced to take extreme measures in order to meet all its obligations. In particular, a company may sell its production assets, reserves, or even one of its business units, which, of course, can harm it both at the moment and negatively affect its financial condition in the long term.
The basis for calculating liquidity ratios are the current assets of the enterprise and current liabilities taken from the form of its balance sheet.
Liquidity ratios are different, some of them are listed below.
Current liquidity ratio.
The current liquidity ratio is the ability of an enterprise to cover its short-term liabilities with current assets.
Current liquidity ratio = current assets / current liabilities
If the current ratio is 1 or higher, this indicates that the company can successfully cover its short-term obligations. If the coefficient is less than 1, it is possible that the company has problems or financial difficulties.
Quick liquidity ratio.
This parameter acts as a supplement and refinement of the current liquidity ratio. The quick liquidity ratio measures the most easily marketable current assets that a company can use to cover short-term liabilities. This ratio is more conservative than the previous ratio as it excludes inventories and other current assets that are usually more difficult to convert into money.
(Cash equivalents + commodities + receivables) / current liabilities
Cash ratio.
With the help of this indicator, the company assesses its ability to meet short-term obligations.
(Cash + Marketable Securities) / Current Liabilities
Profitability ratio.
The group includes various indicators of profitability. Based on these ratios, as well as using the parameters of operating activities, it can be concluded whether the company uses its resources rationally to earn money and increase the value of shares.
The long-term profitability of an organization cannot be underestimated. This indicator is important in determining the ability of the firm to long-term survival and efficient operation. It is very important for shareholders as well. It is thanks to these ratios that all components of profit can be estimated.
This group consists of 4 profit indicators, each of which is important. These values are reflected in various sections of the income statement.
The income statement includes 4 levels of profit: gross, operating, profit before tax and net profit. When analyzing profitability, the indicator is calculated as a percentage in order to comprehensively assess the profitability of an enterprise for 3–5 years in comparison with similar firms and industry data.
Margin analysis is performed to identify positive/negative trends in profits. For the most part, it is about the quality and growth of the company's income, which affects its shareholder value.
Gross Margin = Gross Profit / Net Sales (Revenue)
Operating margin = operating profit / net sales (revenue)
Profit margin before tax = profit before tax / net sales (revenue)
Net Margin = Net Profit / Net Sales (Revenue)
Debt ratio
The company's debt ratio is the ratio of total debt to all assets in the aggregate. The total includes both short-term and long-term outstanding liabilities. Based on certain debt ratios, you can find out how much debt a company has as a whole, as well as estimate the ratio of its personal capital to the funds payable.
Debt ratios are used to identify the degree of financial risk that an enterprise and its shareholders may face. As a general rule, the larger the debt, the higher the likelihood of financial risks for the business, including bankruptcy.
Debt is one form of financial leverage. The greater the leverage of the enterprise, the higher the financial risk. But at the same time, a certain increase in leverage can have a positive impact on the development of the company. Organizations with high-quality and effective management are always busy looking for the optimal amount of financial leverage for their specific situation.
Debt Ratio = Total Liabilities / Total Assets
The ratio of debt to equity.
This ratio is used to compare the total debt of the enterprise with its share capital in the aggregate. It is an estimate of the share of an organization's balance sheet that is financed by suppliers and creditors.
As with the previous ratio, lower numbers indicate that the firm is using less leverage and is in a strong position.
Operating efficiency indicators.
Each coefficient in this group has a different input. Each metric is designed to measure different segments of an enterprise's overall operating performance. Based on these ratios, one can judge how efficiently the company works, as well as evaluate the quality of its management for the analyzed period.
Operational metrics provide insight into whether a business is successfully using its assets to generate revenue, how effective sales-to-cash conversions are, and how the organization allocates and uses its own resources to increase shareholder value and generate sales.
Generally speaking, the higher these figures, the better for shareholders.
Capital productivity.
Return on assets is a coefficient showing the efficiency of the company's fixed assets (fixed assets) in relation to generating sales. For most enterprises, investment in fixed assets is the most significant component of total assets. The return on assets indicates how effectively the firm manages these significant assets. The higher the annual ratio, the better.
Return on assets = revenue / fixed assets
The ratio of sales (income) per employee.
Based on this indicator, one can judge the volume of sales or revenue per employee. The higher the ratio, the better. Seen from this perspective, labor-intensive organizations (such as retailers) are less productive than high-tech enterprises with good levels of productivity.
Sales per employee = revenue / number of employees (average)
Indicators of the movement of financial resources.
Here we are talking about indicators of financial flows. Particular emphasis is placed on the amount of money generated and the system for ensuring the financial stability of the organization. Based on these ratios, users are able to once again assess how efficiently the company is operating and in what financial condition it is currently in. The measures in this group use cash flow in comparison to other measures of the organization.
Ratio of operating cash flow to sales.
This indicator is the percentage ratio of the operating cash flow of the enterprise with its net sales or income. Based on the ratio, investors evaluate the company's ability to turn sales into cash.
Operating cash flow to sales ratio = operating cash flow / net sales (revenue)
Ratio of free cash flow to operating cash flow.
This ratio is used to measure the relationship between free and operating cash flows. Typically, free cash flow is defined as operating cash flow minus capital costs. In the analysis, it is taken as a significant outflow of funds aimed at maintaining the competitive qualities and efficient operation of the enterprise.
The cash flow remaining after this deduction is the free cash flow. It is used to expand, buy a business and / or ensure the economic stability of the company. The higher the percentage of free cash flow embedded in operating cash flow, the more financially sound the firm is.
Free cash flow to operating cash flow = (operating cash flow - capital expenditures) / operating cash flow
Financial results reporting analysis
The statement of financial results of the company contains information on such indicators as:
- revenue;
- cost price;
- gross profit;
- commercial, administrative expenses;
- revenue from sales;
- Percentage to be paid;
- other income and expenses;
- Net income (loss).
The analysis of financial statements is carried out in order to obtain parameters on the basis of which it is possible to form an objective view of the state of the company. At the same time, experts may be interested in both the current state of affairs and the state of the company in the future. The basis for financial analysis is the data of accounting reports.
Here, a deductive method of analyzing financial statements is applied. First of all, experts study the volume, composition, structure and trends in pre-tax profit from the position of its sources, including income from sales, other activities and other income.
The structure of profit determines its quality. In this regard, as part of the analysis of the income statement, the share of each type of profit is calculated. At the same time, the growth rate of income from sales before taxes is calculated. If the first indicator is higher than the second, we can talk about improving the quality of revenue.
Further, in the process of analysis, it is determined from which sources all types of income are formed. Specialists calculate the share of all types of expenses and establish how individual items affect changes in income. After that, the profit optimization condition is checked: TP revenue > TP full cost.
Income from other types of activities is estimated in the context of the items that form it.
As part of the analysis of financial statements, experts also analyze the structure, volume and dynamics of changes in indicators. Based on the data obtained, it is established how other income and receipts affect the final financial result of the company.
Example
|
Article |
||
|
Cost price |
||
|
Profit |
||
|
Selling expenses |
||
|
Administrative expenses |
||
|
Financial result from sales: |
||
|
Profit |
||
|
Income from participation in other organizations |
||
|
Equity Income |
||
|
Capital cost |
||
|
Other income |
||
|
other expenses |
||
|
Other costs |
||
|
Financial result before tax: |
||
|
Profit |
||
|
Expenses (income) on NPP |
||
|
Net Income: |
||
|
Profit |
||
When analyzing financial statements, they first study the volume and composition of profit in the context of the sources that form it (thousand rubles).
|
Index |
Dynamics |
|||||
|
Sum |
Sum |
Sum |
||||
|
1. Profit from sales |
||||||
|
2. Profit from other activities |
||||||
|
3. Profit before tax |
||||||
In 2017, profit increased by 19.5%. Sales profit increased by 16.4%. Other activities brought the company a profit increase of 75%. However, the share of profit from sales decreased by 2.4%, which indicates a decrease in its quality.
Now we need to analyze the sources of funds formation in the structure and dynamics.
|
Index |
Dynamics |
|||||
|
Amount, million rubles |
Amount, million rubles |
Amount, million rubles |
||||
|
1. Revenue |
||||||
|
2 Cost |
||||||
|
3. Management costs |
||||||
|
4. Selling costs |
||||||
|
5. Sales income |
||||||
The increase in profit from sales in 2017 amounted to 16.4%. Revenue increased by 28.6%, cost by 33.3%, administrative costs by 2.9% and selling expenses by 24.6%. The fact that the share of this indicator has decreased indicates that the conditions for profit optimization were not met, since the total cost of production (TRsp = [(3.6 + 0.318 + 0.157) / (2.7 + 0.309 + 0.126) ] x 100% = 130.0%) increases faster than revenue.
Comprehensive analysis of the company's financial statements
As part of the analysis of financial statements, a set of analytical indicators is formed, the main of which are solvency, financial stability, profitability and turnover.
It is not yet possible to achieve impeccable performance, and therefore the financial condition of any enterprise cannot be called ideal.
The table below shows how changes in some analytical indicators affect the trends in others.
|
Indicators |
Change |
Impact ("+" - positive impact / "-" - negative impact) |
|
Solvency |
"-": decrease in turnover |
|
|
decline |
"+": increase in turnover |
|
|
Financial stability |
"+": growth of solvency "-": decrease in profitability |
|
|
decline |
"+": increase in profitability |
|
|
turnover |
"+": growth of financial stability, growth of profitability "-": decrease in solvency |
|
|
decline |
"+": growth of solvency "-": decrease in financial stability, decrease in profitability |
|
|
Profitability |
"+": increase in turnover "-": decrease in financial stability |
|
|
decline |
"+": growth of financial stability "-": decrease in turnover |
Conducting a comprehensive assessment includes several stages:
- Selection of parameters for a comprehensive assessment. From the analytical indicators used in the study of financial statements, choose those that will be used in a comprehensive assessment.
- Correction of indicators in one direction. If it is impossible to do this for some coefficients, they should be excluded from the complex model.
- Choice of model for complex estimation. Of all the existing ones, it is necessary to choose the one that will be applied in the complex analysis.
- The choice of weights for indicators. If the model provides opportunities for weighted assessments, then weights are determined for individual analytical indicators depending on the degree of their significance for a comprehensive assessment.
- Definition of the ideal value. It is necessary to choose a standard - the best value, including theoretical. As such, you can use the standard, the indicator of the leading players in the market in the industry or in the economic environment, as well as the results of theoretical studies.
- Comprehensive assessment. The basis for the calculations are the initial parameters and the selected model.
- Summing up, conclusion about the financial condition of the enterprise. Based on the obtained value, the analyst evaluates the financial position of the company.
When conducting a comprehensive assessment, experts use a number of methods.
sum method. In this case, all analytical indicators are summarized:

- K is a complex analytical indicator;
- AI is an analytical indicator.
points method. Each indicator is assigned a specific score. Points are summed up.

where Bi is the score indicator.
distance method. This method helps to determine the distance from the reference point to specific values of the estimated indicators.

where Ae is the reference value of the analytical indicator.
"Pitfalls" of the analysis of financial statements
When making a decision on effective management and business interaction, information about the operation of the enterprise is very important, which can be learned from the analysis of financial statements. But there is one caveat - violations cannot be detected immediately. Many enterprises distort the real state of affairs and reflect embellished information in their reports.
As a rule, the falsification of financial statements is in the interests of top managers of the company who want to hide the real situation in the business. Suppose a company is developing poorly, it has a shortage of cash. The top manager instructs the finance department to reflect inaccurate data in the financial statements in order to present economic indicators to lenders or creditors in a more favorable light.
It often happens that company executives improve financial statements in order to successfully sell a business. It goes without saying that no investor wants to buy a business that is doing poorly. In order for the deal to take place, the management of the company interested in selling embellishes the picture.
The widespread belief that financial managers are mostly interested in misrepresenting information in financial statements is erroneous. They only receive orders from top management to make changes. This is due to the fact that any enterprise has internal KPIs that are mandatory for all financial directors. To prevent the company from being fined and losing its position, management tries to do everything possible to ensure that the financial statements correspond to the set plan. But such situations do not occur very often.
The main problem of financial analysis is the inability to promptly detect violations. Financial statements reflect historical information, not the current state of affairs in the company. Moments that can be identified after a certain period of time do not always help to find out the analysis of the company's financial statements. As a rule, they are hidden. And the more complex a business is, the harder it is to detect fraudulent data.
To find out the real picture, the financial statements need to be adjusted by making certain amendments. However, this does not give an exact guarantee that you will be able to see a 100% complete and objective picture, since the current situation in the enterprise changes every day. This is the nuance of the analysis of financial statements.
It is also worth noting that financial statements can be misrepresented not only intentionally. It is not uncommon for reports to be inadvertently misstated. This is due to legislative contradictions and the imperfection of the accounting methodology.
As for the reasons for the deliberate falsification of data, they are personal and public. Personal are determined by the goals pursued by a particular employee. Public ones are an attempt to manipulate the real picture in the interests of the entire enterprise. That is, employees seek to save the firm. But you should always remember that falsifying data can lead to serious and unpleasant consequences.
Each company whose shares are traded on the stock exchange is required to provide reports for the financial year and separately for each quarter. Below we will talk in detail about how to read the financial statements of companies, what to highlight and what to look for in the analysis.
The content of the article:
It is worth saying that often the financial year of companies differs from the calendar year, and may begin in June or February. However, reporting seasons are at the end of January, April, July and October. More than a hundred companies can publish reports these days.
Company financial statements
Usually, all financial statements are published on the official websites of companies in the investor relations sections ( Investor Relations).
Company financial statements- this is a set of data that reveals the current economic situation of the company, its performance and changes in the financial position. Reporting is formed from accounting data.
Structure of the financial report
Quarterly reports represent the financial statements of the company for 3 months. They include reports:
- Profit and Loss Statement
- balance sheet;
- Cash flow statement;
- Statement of changes in equity;
- As well as explanations, plans and strategies of the company.
Any report is, first of all, a very large amount of information, so it is important to learn how to extract the essence from it. Among the set of information, the most important indicators can be distinguished, with the help of which an opinion is formed about the current situation.
- The reporting of companies consists of the main parts ( Statements).
Profit and Loss Statement (Income Statement)
In different sources, it may also be called by such terms as P&L Statement (Profit and Loss) or Statementof Operations. In all cases, we are talking about the same thing. As a rule, if the income statement is positive, then this increases the share price, and negative, on the contrary, lowers it.
Report about incomes and material losses (Income Statement, Statement of Operations, Profit and Loss Statement) is an informative document with the help of which the profitability of an activity is immediately determined. In addition, comparing the report's figures with similar data from the previous period, investors draw conclusions about changes in business profitability and expansion of production.
This report contains the most important information due to three main parameters.
1. Revenue (Revenue, Sales) – This is the total amount of money that the company brings in before deducting any expenses and expenses. It consists not only of income from its activities, but also of investment funds.
- Growth in revenue from ordinary activities- indicates a high demand for products or services;
- Growth of investment revenue- shows that the enterprise has channels for financing the expansion of production, which will positively affect the performance in the future;
- Sale of assets may indicate the sale of non-core industries, which will lead to a decrease in costs. Assets are also sold in connection with current difficulties or a decrease in profitability. In this case, a decrease in production and revenue is expected in the future.
2. Net profit(Net Income) is the company's revenue after deducting all costs, expenses and depreciation. Like other similar indicators, it is good when net profit grows over several years. However, negative net income does not always indicate business inefficiency. It happens that losses occur due to the modernization of production or large investments - this can positively affect the financial result and the value of shares in the future.
3.EBITDA– Earnings before interest, taxes and depreciation ( Earnings Before Interest, Taxes, Depreciation and Amortization). EBITDA is used to compare companies in the same industry with each other. This indicator shows the advantages of a business organization over competitors.
The income statement shows information about the results for the period - quarter, year. The dynamics of changes in indicators is important. Stable growth of indicators indicates a stable financial position.
Adobe Income Statement:
From the above Adobe reporting for the 3rd quarter of 2017, there is a change in indicators in relation to the same for 2016.
Balance sheet
The balance sheet shows the assets that the company owns, the sources of financing of these assets and borrowed funds. The balance sheet shows the situation not for the period, but for the day of the report.
In the balance sheet, the most important data:
- Own funds (Total Stockholders' Equity) - show what part of the assets is financed by own funds.
- Commitments (Total Liabilities) are borrowed sources of asset financing.
Adobe Balance :


To change balance sheet indicators, they are compared with the previous quarterly report:
Cash Flow Statement
Accounting profit does not give the concept of cash- real money earned or lost by the company. To find out these parameters, use the indicator Cash Flow Statement. It shows the real money that was generated or spent during the reporting period. Simply put, CFS indicates how much money a company has, as well as where and how much it was spent.
Revenue in the income statement does not reflect cash income. The cash flow statement shows how much money was physically received by the company and for what purposes it was spent.
Operating cash flow(Operating Cash Flow, OCF) - the amount of money left by the enterprise after spending on activities. This money is used to pay dividends and invest in new projects, loan payments. These funds are used to create reserves for unforeseen expenses.
The lack of free cash makes the company unable to pay its debts on loans and obligations to shareholders. The presence of book profit, but the absence of operating cash indicates a risky accounting method.
Adobe Cash Flow Statement :


Forecasts in reports
After the analysis of the main and fundamental data, the market reacts according to the indicators, but the second reaction of the market comes due to the forecasts and future plans of the company, which is always stated at the end of the reports. New strategies, plans and forecasts, as a rule, are spoken by one of the chief executives, so his words cannot be ignored and be an empty phrase.
- Statement of future earnings The company forecasts the expected profit for the next year. Directly affects the value of shares. After all, if the forecast is positive, then the stock will increase and vice versa.
- Dividend payments. There may be data on plans for future dividend payments in the reports. Both an increase in payments and a decrease in payments can be a positive factor, depending on management's commentary.
- Consistent Expert Estimates is the average of all the analysts who have assessed the company. As a rule, they are often in great demand among traders, because. allow you to get a preliminary forecast for changes in the value of shares.
Estimated indicators for company valuation
Basis for share valuation:
- identification of directions and effectiveness of activities;
- revealing the intrinsic value of a share;
- comparison of the company's business with competitors.
To accomplish these tasks, a number of indicators are considered on the basis of published reporting forms:
- Earnings per share (EPS)
EPS = Net Income - Preferred Dividend Payments / Average Value of Shares Outstanding
So EPS – is the percentage of earnings remaining per share. It is considered the main value in the entire report, because it shows the overall assessment of the performance of companies and is used as a comparative value when choosing them for investment.
If two companies have the same earnings per share, but one of them has a share price several times higher, then it is preferable to invest in a company with a low cost per share. This is due to the fact that with a smaller investment amount, you will receive the same profit.
- P/E ratio
P/E is the ratio of market price (Price) to earnings per share (Earnings per share, EPS).
P/E = Price / EPS
It is believed that a low P / E ratio indicates an undervalued company. A large ratio indicates high value (or overvaluation).
The indicator tells how many years the investment in the business will pay off, or the number of annual profits in the current share price. This coefficient is used to compare different companies in the same industry with each other - the value of the coefficient varies greatly by industry.
The P/E value is used with caution. When calculating, the numerator contains the share price indicator, which includes investors' expectations about the prospects for activity. In the denominator, profit for the past period is lagging behind the current state of affairs. Thus, in essence, the future is divided into the past. The indicator cannot be calculated at all if the company is unprofitable - it will be negative, although this does not mean that the shares must necessarily fall in price.
- High P/E- Investors value stocks dearly, expecting a further increase in profits. This situation occurs when the company's performance has declined, but the stock price has not. Investors hope for further growth in the value of securities and are ready to accept low dividend yields.
- Low P/E – investors are pessimistic about the company's profitability and development.
This does not mean that only securities with a high P/E are bought - the price of such shares already includes expectations of business growth. With a decrease in the company's performance, the share price may be adjusted - since dividends on investments in shares have a minimum level. By purchasing securities of stable companies with low P / E, they expect to increase the value of securities and distribute profits for dividends.
- Liquidity
The liquidity ratio is an indicator of solvency. There are several coefficients. The main indicator is current liquidity.
Current liquidity \u003d Current assets / Debt on loans
- Business activity of the company
This indicator is determined by the value of the asset turnover ratio - KOA.
KOA = Sales Revenue / Asset Value
Liquidity indicates the solvency and overall reliability of the company. The recommended value is not less than 2. If the value of the indicator is 2, the assets in circulation exceed the debt on loans twice. The company, having sold half of the products and stocks, will pay off debts.
If the value is less than 1, loans exceed working capital. And even after their implementation, it will not be possible to pay off the debts. You need to look for sources of refinancing or sell part of the fixed assets.
- Financial stability (Leverage)
Determined by indicator financial leverage. The higher the ratio, the more efficient the activity - with a lower value of assets, the company produces more goods and services.
Leverage = Debt on loans / Equity
The indicator differs by industry - each has its own specifics. But for enterprises in one sector, KOA is a defining indicator.
The lower the debt, the lower the risks for investors. The lower the ratio of liabilities to equity, the lower the risks of financing and the lower the cost of servicing debts.
When assessing the level of debt to equity, it is compared with the performance of competitors operating in the same business area. The normal level of debt in companies of different industries is different.
- Company value
Enterprise value (EV) – The most commonly used indicator. Reflects the amount that must be paid to the investor for the acquisition of the entire company. It is defined as the sum of the value of a company's shares and debt, minus investments in other companies and cash. Money and investments are subtracted from the value, since these funds can be used to pay off debt obligations. EV is often used to compare with historical EBITDA and with other companies.
In the presence of individual negative factors, an in-depth analysis is carried out with the evaluation of a large number of indicators.
Let's go back to our Adobe example:


After the release of the reporting, traders compare the data with the forecast values:
- If, when a new report is released, its indicators exceed the expectations of experts, then the share price increases.
- Falling data below the forecasted level leads to a decrease in the value of shares.
As can be seen from the reporting of Adobe Corporation - the company has significantly improved its profitability and profitability. At the same time, the data of the report exceeded not only the consensus forecast of analysts, but also the corporation's own plans. The result was the reaction of the market:


The trading chart shows a gap (gap) between trading on 10/18/2017 ($153.06) and the opening price of trading on 10/19/2017 – $165.68. This is how the market reacted to the company's report released between trading sessions.
Financial Statement Books
To understand the possibilities of using reporting in the analysis of the value of shares, books that have received recognition from experts will help. Knowing the features of reporting, the investor makes competent decisions and does not miss the details.
- "Analysis of financial statements of companies" by Benjamin Graham, Spencer B. Meredith.
The book is a guide to the analysis of company reporting. This manual was first published in 1937, but has not lost its relevance today. The book is popular and has been praised by experts as a guide for investors in the stock market. It presents guidelines and tips for analyzing the financial statements of companies and organizations that are relevant to this day, compiled by B. Graham, a well-known investment expert in his time. The book is written in clear and simple language and is of great value to modern investors. Introduction by modern investment specialist Michael F. Price The book is not large - 148 pages, but it covers all the most important rules for reporting analysis.
- "Valuation of companies: Analysis and forecasting using IFRS reporting"- Authors Nick Antill, Kenneth Lee.
This book contains the opinions of financial market analysts on methods for assessing the value of companies based on IFRS reporting. The book is a voluminous material on 570 pages with illustrations. The book sets out the different points of view of investment analysts and how companies will be valued based on their financial statements in accordance with IFRS. Examples of insurance, mining companies and banks that use IFRS in their assessment are given. The most complex assets and liabilities for analysis are highlighted. The book contains 205 illustrations for clarity and better understanding of the material.
- "Analysis of financial statements"- author N.S. Plaskov.
The book tells about modern methods of analysis of financial statements. Their practical application will improve the quality of management of various organizations and contribute to the formation of an optimal management strategy. The book is intended primarily for teachers and students of economic faculties, financial managers, analysts, all kinds of investors and other people who connect their lives with the financial sector.
An example of trading on financial statements
We will show an example of real trading on NVIDIA (NASDAQ: NVDA) reports.
The broker provides a professional trading platform and the best conditions. Recommended initial deposit $250 .
The Libertex platform is owned by a broker with more than 20 years of experience and has serious regulators. Here you will find a huge number of stocks and ETFs. The broker offers a huge asset base, an academy (training programs), constantly holds webinars, provides analytics and has a very convenient trading platform with a large number of indicators connected to it. Minimum deposit $200 .
Instead of output
As a result, it can be emphasized once again that the latest financial results of companies are the most important tool for traders. It allows them to soberly assess the prospects of market participants, find new worthy objects for investment and successfully invest their money in them.
The numbers and graphs of the reports speak better than any analysts' forecasts.
And the one who knows how to correctly interpret the information received, even with a modest investment of several tens of thousands of dollars, can close the auction with a profit of seven figures.
If you find an error, please highlight a piece of text and click Ctrl+Enter.