Investment projects can be evaluated according to many criteria - in terms of their social significance, the scale of environmental impact, the degree of involvement labor resources etc. However, efficiency is central to these assessments.
Efficiency is generally understood as the correspondence between the results obtained from the project - both economic (in particular, profits) and non-economic (removal of social tension in the region) - and the costs of the project.
The effectiveness of an investment project is a category that reflects the compliance of the project that generates this IP with the goals and interests of the project participants, which are understood as the subjects of investment activity (discussed above) and society as a whole. Therefore, the term "efficiency of the investment project" is understood as the effectiveness of the project. The same applies to performance indicators.
Among the basic principles and approaches that have been developed in world practice to assess the effectiveness of investment projects, the following can be distinguished:
- modeling of product flows, resources and Money;
- taking into account the results of the market analysis, the financial condition of the enterprise applying for the implementation of the project, the degree of trust in the project managers, the impact of the project on the environment, etc.;
- determining the effect by comparing future results and costs with a focus on achieving the required rate of return on capital and other criteria;
- bringing the forthcoming multi-temporal expenses and incomes to the conditions of their commensurability in terms of economic value in the initial period;
- taking into account the impact of inflation, payment delays and other factors on the value of the funds used;
- taking into account the uncertainty and risks associated with the implementation of the project.
It is proposed to evaluate the following types of efficiency:
1) the effectiveness of the project as a whole;
2) the effectiveness of participation in the project.
The effectiveness of the project as a whole. It is evaluated in order to determine the potential attractiveness of the project, the expediency of its adoption for possible participants. It shows the objective acceptability of IP, regardless of financial opportunities its members. This efficiency, in turn, includes:
Public (socio-economic) efficiency of the project;
The commercial viability of the project.
Social efficiency takes into account the socio-economic consequences of the implementation of an investment project for society as a whole, including both the direct costs of the project and the results from the project, and "external effects" - social, environmental and other effects.
The commercial efficiency of the investment project shows the financial consequences of its implementation for the IP participant, assuming that he independently produces all necessary costs to the project and enjoy all its results. In other words, when evaluating commercial efficiency it is necessary to abstract from the possibilities of the project participants to finance the costs of IP, conventionally assuming that the necessary funds are available.
The effectiveness of participation in the project. It is determined in order to verify the financial feasibility of the project and the interest in it of all its participants. This efficiency includes:
The effectiveness of the participation of enterprises in the project (its effectiveness for enterprises - participants in the investment project);
Efficiency of investing in the company's shares (efficiency for JSC shareholders - participants in the investment project);
Efficiency of participation in the project of structures of a higher level in relation to the enterprises participating in the IP (national economic, regional, sectoral and other efficiency);
The budgetary efficiency of the IP (the effectiveness of the state's participation in the project in terms of expenditures and revenues of budgets of all levels).
General scheme for evaluating the effectiveness of an investment project. First of all, the social significance of the project is determined, and then, in two stages, the effectiveness of the IP is assessed. At the first stage, the performance indicators of the project as a whole are calculated. Wherein:
- if the project is not socially significant (local project), then only its commercial effectiveness is evaluated;
- for socially significant projects, their social effectiveness is first assessed (methods for such an assessment are outlined in the Methodological Recommendations).
If such efficiency is unsatisfactory, then the project is not recommended for implementation and cannot qualify for state support. If the social efficiency is acceptable, then the commercial efficiency is evaluated. With insufficient commercial efficiency of a socially significant individual entrepreneur, it is necessary to consider various options its support, which would increase the commercial efficiency of IP to an acceptable level. If the conditions and sources of financing of socially significant projects are already known, then their commercial effectiveness can not be assessed.
The second stage of the assessment is carried out after the development of the financing scheme. At this stage, the composition of the participants is specified and the financial feasibility and effectiveness of participation in the project of each of them are determined. It is possible to formulate the main tasks that have to be solved when evaluating the effectiveness of investment projects:
1. Evaluation of the feasibility of the project - verification of its satisfaction with all real-life restrictions of a technical, environmental, financial and other nature. Usually, all constraints, except financial feasibility, are checked at the early stages of project formation. The financial feasibility of an investment project is the provision of such a structure of cash flows, in which at each calculation step there is a sufficient amount of money to implement the project that generates this IP. Accordingly, the cash flows of the investment project are understood as the cash flows of the project associated with this IP.
2. Evaluation of the potential feasibility of the project, its absolute effectiveness, that is, checking the condition according to which the cumulative results of the project are no less valuable than the required costs of all types.
3. Evaluation of the comparative effectiveness of the project, which is understood as an assessment of the advantages of the project under consideration in comparison with the alternative.
4. Evaluation of the most effective set of projects from their entire set. Essentially, this is the task of optimizing an investment project, and it generalizes the previous three tasks. As part of solving this problem, it is also possible to rank projects, that is, the choice of the optimal project.
The main methods for evaluating the effectiveness of investment projects
There are two groups of methods for evaluating investment projects:
1. simple or static methods;
2. methods of discounting.
Simple or static methods are based on the assumption of equal importance of income and expenses in investment activity, do not take into account the time value of money.
The simple ones include: a) calculation of the payback period; b) calculation of the rate of return.
The rate of profit shows how much investment costs reimbursed in the form of profit. It is calculated as the ratio net profit to investment costs:
Rate of return = Net profit / Investment costs.
Discounted methods for evaluating the effectiveness of an investment project are characterized by the fact that they take into account the time value of money.
In the economic evaluation of the effectiveness of an investment project, indicators widely known in world practice are used:
Present Value (PV);
Net Present Value (NPV);
Payback period (PBP);
Internal rate of return (IRR);
Index of profitability (profitability) (PI).
Present Value (PV). The task of any investor is to find such a real tool that would ultimately bring income that exceeds the cost of acquiring it. In this case, a complex problem arises: the money for the acquisition of a real asset must be spent today (at the moment t = 0), while the return on investment usually does not give immediately, but after a certain period of time (at the moment t = 1). Therefore, to solve the problem, it is necessary to determine the value of a real asset, taking into account the remoteness in time of future receipts (revenues) from its use.
In general, to find the present value PV of any asset (real or financial) used during a certain holding (investment) period, it is necessary to multiply the expected income stream from this asset (C) by 1/(1 + r):
PV = C * (1/(1+r)) ,
where r determines the return on the best alternative financial asset with the same holding period and the same level of risk.
The value 1/(1+r) is called the discount factor (discount factor). The yield of an alternative financial resource r is called the discount rate (rate). The discount rate determines the opportunity cost of capital, because it characterizes how much profit the firm has missed by investing money in real assets, and not in the best alternative financial means.
To determine the feasibility of acquiring a real asset worth C0 rubles, you must:
a) estimate what cash flow C1 for the entire holding period he expects from a real asset;
b) find out which security with the same holding period has the same level of risk as the planned project;
c) determine the current yield r of this security;
d) calculate the present value PV of the planned cash flow C1 by discounting the future income flow:
PV = C1 / (1+r) ;
e) compare the investment costs C0 with the present value PV:
if PV > C0, then the real asset can be bought;
if PV = C0, then a real asset can be bought or not bought (that is, from an economic point of view, investing in a real asset has no advantage compared to investing money in securities or other objects).
If the investment project is designed for several steps (in particular, n years), then in order to find the present value of future income from the project, it is necessary to discount all the amounts Сt that the project should provide:
PV = Σ Ct / (1+r)^t .
For example, for a three-year investment project, the present value is estimated in the following way:
PV = Ct / (1+r) + Ct / (1+r)^2 + Ct / (1+r)^3 .
Some funds can provide a continuous stream of income for an unlimited time. The present value of such funds at a given and constant discount rate r is:
PV = Ct / (1+r) + Ct / (1+r)^2 + Ct / (1+r)^3 + ... = C / r .
The present value of an annuity that gives an income stream C over n periods (years) at a constant discount rate r is calculated by the formula:
PVannuity \u003d C * Fannuity,
where F annuity is the annuity factor, which is defined as follows:
F annuity = 1/r - 1/(1+r)^n .
Net Present Value (NPV)
The feasibility of acquiring a real asset can be assessed using net present value (NPV), which is understood as a net increase in the company's potential assets due to the implementation of the project. In other words, NPV is defined as the difference between the present value PV of the funds and the amount of the initial investment C0:
NPV = Σ Ct / (1+r)^n - C0 .
Payback period (RVR)
The payback period of a project is the period during which the initial investment costs are recovered, or the number of periods (calculation steps, for example, years) during which the accumulated amount of estimated future income flows will be equal to the amount of the initial investment. As a rule, the company itself sets an acceptable deadline for the completion of the investment project, for example, k steps. This period is determined by the company on the basis of its own strategic and tactical settings: for example, the company's management rejects any projects lasting more than 5 years, since in 5 years the company is planned to re-profile for the production of other products.
When the deadline k for the completion of alternative projects is determined, then the payback period of the project being evaluated can be found by calculating how many calculation steps m the sum of cash flows C1 + C2 + ... + Cm will be equal to or begin to exceed the value of the initial investment C0. In other words, to determine the payback period of the project, it is necessary to consistently compare the accumulated amounts of income with the initial investment. According to the payback period rule, the project can be accepted if the following condition is met: m
Internal rate of return (IRR)
The internal rate of return is the estimated discount rate at which the project's net present value is zero.
It is found by solving the following equation:
NPV = C0 + C1/(1+IRR) + C2/(1+IRR)^2 + C3/(1+IRR)^3 + ... + Cn/(1+IRR)^n = 0 .
Such an equation is solved by iteration. To calculate the IRR, you can use specially programmed calculators or computer programs. Internal rate of return rule: it is necessary to accept those projects for which the discount rate (that is, the cost of lost capital opportunity) is less than the internal rate of return of the project (r
The profitability index (PI) is understood as a value equal to the ratio of the present value of the expected cash flows from the implementation of the project to the initial cost of investment:
The profitability index shows how much the investor receives for the invested ruble. The profitability index rule is as follows: it is necessary to accept only those projects for which the value of the profitability index exceeds one. When evaluating two or more projects that have a positive profitability index, one should opt for the one that has a higher profitability index.
The effectiveness of the IP is assessed during the billing period - the investment horizon from the start of the project to its liquidation. The start of a project is usually associated with the start date of investment in design and survey work. The calculation period is divided into calculation steps, which are periods of time within which data is aggregated to estimate cash flows and cash flows are discounted.
It is customary to number the calculation steps (step 0, step 1, step 2, etc.). The duration of calculation steps is measured in years or fractions of a year, their sequence is counted from a fixed moment t0 = 0, taken as the base one. For reasons of convenience, the start or end time of the zero step is usually taken as the base time. If several projects are compared, it is recommended to choose the same base moment for them. When the base moment coincides with the beginning of the zero step, the moment of the beginning of step number m is denoted by tm, if the base moment coincides with the end of step 0, then tm denotes the end of step m of the calculation. The duration of different steps may be different.
Source - Maksimova V.F. Investment management: Educational and practical guide. – M.: Ed. EAOI center. 2007. - M., 2007. - 214 p.
Posted on the site 05/14/2009
In the conditions of the world economic crisis construction sector Russian economy is experiencing serious difficulties, in particular, limited access to credit resources. The article considers an example of evaluating the effectiveness of an investment project for the construction of a multifunctional complex.
A.V. Zemtsov, independent expert
Criteria and methods for evaluating investment projects
The financial and economic evaluation of investment projects occupies a central place in the process of substantiating and selecting possible options for investing in transactions with real assets. To a large extent, it is based on project analysis. The purpose of the project analysis is to determine the result (value) of the project. To do this, use the expression:
Project result = project price - project costs.
It is customary to distinguish between technical, financial, commercial, environmental, organizational (institutional), social, economic and other assessments of an investment project.
Predictive assessment of the project is a rather difficult task, which is confirmed by a number of factors:
1) investment expenditures can be made either on a one-time basis or over a sufficiently long period of time;
2) the period of achievement of the results of the implementation of the investment project may be greater than or equal to the calculated one;
3) the implementation of long-term operations leads to an increase in uncertainty in the assessment of all aspects of investments, that is, to an increase in investment risk.
The effectiveness of an investment project is characterized by a system of indicators reflecting the ratio of costs and results, depending on the interests of its participants.
Evaluation of the overall project effectiveness for the investor
Investment projects can be both commercial and non-commercial. Even with non-commercial projects, there are opportunities spent and opportunities received.
The difference between investment projects and current activities is that the costs intended for a one-time acquisition of some opportunities do not apply to investments. It turns out that an investor is a person who invests his opportunities for multiple use, forcing them to work to create new opportunities.
If for commercial projects there are ways to evaluate the effectiveness, then how to evaluate the effectiveness of non-commercial projects? Efficiency is generally understood as the degree of compliance with the goal 1 . The goal should be set precisely, in detail, and allow only an unambiguous answer - whether it has been achieved or not. At the same time, you can achieve the goal in different ways, and each path has its own costs.
For implementation decision commercial project its economic efficiency is evaluated. In the case of a non-commercial project, if it is decided to achieve the goal, then the choice is to determine the most effective way. At the same time, non-financial criteria should take precedence over financial ones. But at the same time, the goal must be achieved in the least costly way.
Also when evaluating a non-commercial project:
Consideration should be given to the stability of the investor to the implementation of the project - whether the investor will withstand the implementation of the project;
When identifying alternatives of equal quality, the cheapest one is usually selected;
It is advisable to plan the movement of costs (investments) in dynamics in order to calculate forces in advance, provide for a deficit and take care of attracting additional resources, if necessary.
Assessment of project externalities
The second aspect of project appraisal is that the project may be of value to more than just the investor. For example, investments in the knowledge of some people brought benefits not to themselves, but to society as a whole, which then used the discoveries and inventions of scientists for their own needs. Ordinary commercial investment projects of companies, in addition to commercial significance, also have the following effects:
Social;
tax;
Budget;
Ecological.
All effects of the project are important for other parties, as the company and the project are surrounded by society, people, the state, and nature. If the project improves the environment, then it is better for the company implementing the project, because everything in the world is interconnected.
1. The social effect is assessed by the benefits of the project for the population, either living around the project site or working on the project, and consists of:
In raising the level of salaries;
Development of infrastructure and other opportunities for the population around the project site.
2. The tax effect is estimated by the volume of taxes collected from the project to the local, regional and federal budget.
3. The budget effect is assessed if the project is fully or partially financed from the budget (federal, regional, local). It is determined how much money the project returns to the budget through taxes, after the budget has invested in the project, over a certain number of years.
4. An environmental effect takes place if the project in one way or another affects the ecological situation.
Economic approach in evaluating the effectiveness of an investment project
The vast majority of decisions made by market economy entities are based on a preliminary assessment of the expected consequences. An individual assessment of the acceptability (efficiency, value) of each investment project is carried out using various methods and taking into account certain criteria. We have analyzed Russian and foreign methods for evaluating investment projects and practical examples the application of these methods is shown.
General approaches to determining the effectiveness of investment projects
Investment decision-making is based on the assessment of the economic efficiency of investments. A market economy requires taking into account the impact on the efficiency of investment activity of environmental factors and the time factor, which are not fully evaluated in the calculation of these indicators.
They quite fully reflect the results of scientific research by domestic and foreign economists in the field of methods for evaluating efficiency. The performance indicators of investment projects according to the Methodological recommendations are divided into the following types 3:
Commercial performance indicators that take into account the financial implications of the project implementation for its direct participants;
Budget performance indicators reflecting the financial implications of the project implementation for the federal, regional or local budgets;
Economic efficiency indicators that take into account the results and costs associated with the implementation of the investment project, which go beyond the direct financial interests of the project participants and allow value measurement.
The allocation of such types is artificial and is associated with the definition of a single indicator of economic efficiency, but in relation to different objects and levels economic system: the national economy as a whole (global criterion of economic efficiency), regional, sectoral, enterprise level or a specific investment project.
According to methodological recommendations, the effectiveness of investments is characterized by a system of indicators that reflect the ratio of costs and results associated with investments and make it possible to judge the economic advantages of some investments over others.
Investment performance indicators can be classified according to the following criteria 4:
1) by the type of generalizing indicator, which acts as a criterion for the economic efficiency of investments:
Absolute, in which generalizing indicators are defined as the difference between the cost estimates of the results and costs associated with the implementation of the project;
Relative, in which generalizing indicators are defined as the ratio of cost estimates of project results to the total costs of obtaining them;
Temporary, which evaluates the payback period of investment costs;
2) according to the method of comparing multi-time cash costs and results:
Static, in which cash flows arising at different points in time are evaluated as equivalent;
Dynamic, in which the cash flows caused by the implementation of the project are reduced to an equivalent basis by discounting them, ensuring the comparability of cash flows at different times.
Static methods are also called methods based on accounting estimates, and dynamic methods are called methods based on discounted estimates 5 .
To group of static include methods: payback period of investment (Payback Period, PP); investment efficiency ratio (Accounting Rate of Return, ARR).
To dynamic methods include: net present value, net present value (Net Present Value, NPV); return on investment index (Profitability Index, PI); internal norm profitability (Internal Rate of Return, IRR); modified internal rate of return (Modified Internal Rate of Return, MIRR), discounted payback period of the investment (Discounted Payback Period, DPP).
It should also be noted that the evaluation of the effectiveness of each investment project is carried out taking into account criteria that meet certain principles, namely:
Effects of the value of money over time;
opportunity cost;
Possible changes in project parameters;
Carrying out calculations based on real cash flow, and not accounting indicators;
Inflation and its reflection;
The risk associated with the implementation of the project.
Let us consider the main methods for evaluating the effectiveness of investment projects in more detail and find out their main advantages and disadvantages.
Static evaluation methods
Payback Period (PP)
The most common static indicator for evaluating investment projects is the term payback (Payback Period, PP).
The payback period is understood as the period of time from the start of the project until the operation of the facility, when the income from operation becomes equal to the initial investment (capital costs and operating costs).
This indicator gives an answer to the question: when will the full return on invested capital occur? The economic meaning of the indicator is to determine the period for which the investor can return the invested capital.
To calculate the payback period, the elements of the payment series are summed up on an accrual basis, forming the balance of the accumulated flow, until the amount takes a positive value. The serial number of the planning interval, in which the balance of the accumulated flow takes a positive value, indicates the payback period, expressed in planning intervals. General formula calculation of the PP indicator has the form:
where P k is the value of the accumulated flow balance;
I 0 - the value of the initial investment.
When a fractional number is received, it is rounded up to the nearest whole number. Often, the PP indicator is calculated more accurately, that is, the fractional part of the interval (billing period) is also considered; at the same time, it is assumed that within one step (calculated period), the balance of accumulated cash flow changes linearly. Then the "distance" x from the beginning of the step to the moment of payback (expressed in the duration of the calculation step) is determined by the formula:

where P k- is the negative value of the balance of the accumulated flow at the step up to the payback moment;
P k+ is a positive value of the balance of the accumulated flow at the step after the payback moment.
As a measuring instrument, the "payback period" criterion is simple and easy to understand. However, it has significant disadvantages, which we will consider in more detail when analyzing the discounted payback period (DPP), since these disadvantages apply to both static and dynamic payback period indicators. The main drawback of the static indicator "payback period" is that it does not take into account the time value of money, that is, it does not distinguish between projects with the same balance of the income stream, but with a different distribution over the years.
Investment efficiency ratio (Accounting Rate of Return, ARR)
Another indicator of the static financial evaluation of the project is the investment efficiency ratio (Account Rate of Return or ARR). This ratio is also called the accounting rate of return or the profitability ratio of the project.
There are several algorithms for calculating ARR.
The first calculation option is based on the ratio of the average annual profit (minus deductions to the budget) from the implementation of the project for the period to the average investment:
I av 0 - the average value of the initial investment, if it is assumed that after the expiration of the project, all capital costs will be written off.
Sometimes the profitability of the project is calculated based on the initial investment:
Calculated on the basis of the initial investment, it can be used for projects that create a stream of uniform income (for example, an annuity), for an indefinite or sufficiently long period.
The second calculation option is based on the ratio of the average annual profit (minus deductions to the budget) from the implementation of the project for the period to the average investment, taking into account the residual or salvage value of the initial investment (for example, taking into account the salvage value of equipment at the end of the project):
where P r is the average annual profit (minus deductions to the budget) from the implementation of the project;
I 0 - the average value (value) of the initial investment.
Dynamic evaluation methods
Net present value (Net Present Value, NPV)
In modern published works, the following terms are used to name the criterion of this method: net present value 6 ; net present income 7 ; net present value 8 ; net present value 9 ; overall financial result from the implementation of the project 10 ; present value 11 .
The amount of net present value (NPV) is calculated as the difference between the discounted cash flows of income and expenses incurred in the process of implementing the investment over the forecast period.
The essence of the criterion is to compare the current value of future cash receipts from the implementation of the project with the investment costs necessary for its implementation.
The application of the method involves the sequential passage of the following stages:
1) calculation of the cash flow of the investment project;
2) the choice of a discount rate that takes into account the profitability of alternative investments and the risk of the project;
3) determination of net present value.
NPV or NPV for a constant discount rate and a one-time initial investment is determined by following formula:
![]()
where I 0 - the value of the initial investment;
i - discount rate.
Cash flows must be calculated at current or deflated prices. When forecasting income by years, it is necessary, if possible, to take into account all types of receipts, both production and non-production nature, which can be associated with this project. So, if at the end of the project implementation period it is planned to receive funds in the form of the salvage value of equipment or the release of part working capital, they should be accounted for as income of the respective periods.
This method is based on the premise that the value of money varies over time. The process of converting the future value of a cash flow into a current value is called discounting(from English. discount- decrease).
The rate at which discounting takes place is called the rate. discounting (discount), and the factor F = 1/(1 + i) t is discount factor.
If the project involves not a one-time investment, but a consistent investment of financial resources over a number of years, then the formula for calculating NPV is modified as follows:

where I t is the cash flow of the initial investment;
C t - cash flow from the sale of investments at time t;
t is the calculation step (year, quarter, month, etc.);
i - discount rate.
The conditions for making an investment decision based on this criterion are as follows:
If NPV > 0, then the project should be accepted;
If NPV< 0, то проект принимать не следует;
If NPV = 0, then the adoption of the project will bring neither profit nor loss.
This method is based on following the main target setting, determined by the investor, - maximizing its end state or increasing the value of the firm. Following this target setting is one of the conditions comparative evaluation investment based on this criterion.
The negative value of the net present value indicates the inexpediency of making decisions on financing and implementing the project, since if NPV< 0, то в случае принятия проекта ценность компании уменьшится, то есть владельцы компании понесут убыток и основная целевая установка не выполнится.
A positive value of the net present value indicates the feasibility of making decisions on financing and implementing the project, and when comparing investment options, the option with the highest NPV is considered preferable, because if NPV > 0, then if the project is accepted, the value of the company, and hence the well-being of its owners will increase. If NPV = 0, then the project should be accepted provided that its implementation will increase the flow of income from previously implemented capital investment projects. For example, the extension land plot for the hotel car park will boost the real estate income stream.
The implementation of this method involves a number of assumptions that need to be checked for the degree of their correspondence to reality and for what results possible deviations lead to.
Such assumptions include:
The existence of only one objective function - the cost of capital;
The specified period for the implementation of the project;
Data reliability;
Belonging of payments to certain points in time;
The existence of a perfect capital market.
When making decisions in investment sphere often you have to deal not with one goal, but with several target settings. In the case of using the method of determining the cost of capital, these objectives should be taken into account when finding a solution outside the process of calculating the cost of capital. At the same time, methods for making multi-purpose decisions can also be analyzed.
The useful life should be established in the performance analysis before applying the net present value method. To this end, methods for determining the optimal service life can be analyzed, unless it is established in advance for technical or legal reasons.
In reality, when making investment decisions, there is no reliable data. Therefore, along with the proposed method for calculating the cost of capital based on predicted data, it is necessary to analyze the degree of uncertainty, at least for the most important investment objects. This purpose is served by methods of investing in conditions of uncertainty.
When forming and analyzing the method, it is assumed that all payments can be attributed to certain points in time. The time interval between payments is usually one year. In fact, payments can be made at shorter intervals. In this case, you should pay attention to the compliance of the settlement period step (calculation step) with the condition for granting a loan. For the correct application of this method, it is necessary that the calculation step be equal to or a multiple of the term for calculating interest on the loan.
Also problematic is the assumption of a perfect capital market, in which financial resources can be attracted or invested at a single calculated interest rate at any time and in unlimited quantities. In reality, there is no such market, and interest rates for investing and borrowing financial resources usually differ from each other. As a result, there is a problem of determining the appropriate interest rate. This is especially important as it has a significant impact on the cost of capital.
When calculating NPV, different discount rates can be used over the years. In this case, it is necessary to apply individual discount factors to each cash flow, which will correspond to this calculation step. In addition, it is possible that a project that is acceptable at a constant discount rate may become unacceptable at a variable one.
The net present value indicator takes into account the time value of money, has clear decision criteria and allows you to select projects to maximize the value of the company. Besides, this indicator is absolute and has the property of additivity, which allows you to add the values of the indicator for different projects and use the total indicator for projects for optimization purposes investment portfolio, that is, the following equality is true:
NPV A + NPV B = NPV MB .
With all its advantages, the method also has significant disadvantages. Due to the difficulty and ambiguity of forecasting and generating cash flow from investments, as well as the problem of choosing a discount rate, there may be a danger of underestimating the risk of a project.
Profitability Index (PI)
The profitability index (profitability, profitability) is calculated as the ratio of the net present value of cash inflow to the net present value of cash outflow (including initial investment):
![]()

where I 0 is the investment of the enterprise at time 0;
i - discount rate.
The profitability index is a relative indicator of the effectiveness of an investment project and characterizes the level of income per unit of costs, that is, the effectiveness of investments - the greater the value of this indicator, the higher the return on the monetary unit invested in this project. This indicator should be preferred when completing an investment portfolio in order to maximize the total value of NPV.
The conditions for accepting a project under this investment criterion are as follows:
If PI > 1, then the project should be accepted;
If PI< 1, то проект следует отвергнуть;
If PI = 1, the project is neither profitable nor unprofitable. It is easy to see that when evaluating projects involving the same amount of initial investment, the PI criterion is fully consistent with the NPV criterion.
Thus, the PI criterion has an advantage when choosing one project from a number of projects with approximately the same NPV values, but different amounts of required investments. In this case, the one that provides greater efficiency of investments is more profitable. In this regard, this indicator allows you to rank projects with limited investment resources.
The disadvantages of the method include its ambiguity when discounting separately cash inflows and outflows.
Internal Rate of Return (IRR)
Under internal rate of return, or the internal rate of return, investment (IRR) understand the value of the discount rate at which the NPV of the project is zero:
IRR = i, where NPV = f(i) = 0.
The meaning of calculating this coefficient when analyzing the effectiveness of planned investments is as follows: The IRR indicates the maximum allowable relative level of expenditure that can be associated with a given project. For example, if the project is financed entirely by a loan commercial bank, then the IRR value shows the upper bound acceptable level bank interest rate, the excess of which makes the project unprofitable.
In practice, any enterprise finances its activities from various sources. As a payment for the use of financial resources advanced to the activities of the enterprise, it pays interest, dividends, remuneration, etc., that is, it bears some reasonable expenses to maintain its economic potential. An indicator characterizing the relative level of these incomes can be called the price of advanced capital (capital cost, CC). This indicator reflects the minimum return on the capital invested in its activities, its profitability, which has developed at the enterprise, and is calculated using the arithmetic weighted average formula.
The economic meaning of this indicator is as follows: an enterprise can make any decisions of an investment nature, the level of profitability of which is not lower than the current value of the CC indicator (price of the source of funds for this project). It is with him that the IRR indicator calculated for a specific project is compared, while the relationship between them is as follows:
If IRR > СС, then the project should be accepted;
If IRR< СС, то проект следует отвергнуть;
0 if IRR = СС, then the project is neither profitable nor unprofitable.
Another interpretation is to interpret the internal rate of return as a possible discount rate at which the project is still profitable according to the NPV criterion. The decision is made on the basis of comparing the IRR with the standard profitability; at the same time, the higher the values of the internal rate of return and the greater the difference between its value and the selected discount rate, the greater the safety margin of the project. This criterion is the main guideline in making an investment decision by an investor, which does not detract from the role of other criteria. To calculate IRR using discount tables, two values of the discount factor r are selected< i 2 таким образом, чтобы в интервале (i, …, i 2) функция NPV = f(i) меняла свое значение с «+» на «-» или с «-» на «+». Далее применяют формулу:
![]()
where r 1 is the value of the discount factor at which f (i 1) > 0 (f (i 1)< 0);
r 2 - the value of the discount factor at which f (i 1)< 0 (f (i 1) > 0).
The accuracy of the calculations is inversely proportional to the length of the interval (i 1 , ..., i 2), and the best approximation is achieved when i 1 and i 2 are the nearest to each other values of the discount coefficient that satisfy the conditions.
An accurate calculation of the IRR value is possible only with the help of a computer.
The corresponding assumption of the method of determining the internal rate (investment at the internal interest rate) is generally not appropriate. Therefore, the method of determining the internal rate of return without taking into account specific reserve investments or other modification of conditions should not be used to assess absolute profitability if complex investments are taking place and thereby a reinvestment process occurs. With this type of investment, there is also the problem of the existence of several positive or negative internal interest rates, which can lead to difficulties in interpreting the results obtained by the method of determining the internal rate of return.
The method of determining the internal rate of return for assessing relative profitability should not be applied, as noted above, by comparing the internal interest rates of individual objects. Instead, the investment must be analyzed to determine the difference. If a we are talking about investments made in isolation, the internal interest rate can be compared with the estimated rate to make comparisons possible. If investments for comparing profitability are complex, then the use of the method of determining profitability is inappropriate.
The advantage of the internal rate of return method in relation to the net present value method is the possibility of its interpretation. It characterizes the accrual of interest on the capital expended (return on capital employed).
In addition, the internal interest rate can be considered as a critical interest rate for determining the absolute profitability of an investment alternative if the net present value method is applied and the assumption of “reliable data” does not apply.
Thus, the evaluation of investments using this method is based on determining the maximum value of the discount rate at which projects will break even.
The NPV, IRR and PI criteria most commonly used in investment analysis are actually different versions of the same concept, and therefore their results are related to each other. Thus, we can expect the following mathematical relationships to be fulfilled for one project:
If NPV > 0, then IRR > CC(r); PI > 1;
If NPV< 0, то IRR < CC (r); PI < 1;
If NPV = 0, then IRR = CC(r); PI = 1.
There are techniques that adjust the IRR method for application in a particular non-standard situation. One of these methods is the modified internal rate of return (MIRR) method.
Modified Internal Rate of Return (MIRR)
Modified rate of return (MIRR) eliminates a significant drawback of the internal rate of return of the project, which occurs in the case of repeated cash outflows. An example of such repeated outflows is an installment purchase or construction of a property over several years. The main difference of this method is that reinvestment is carried out at a risk-free rate, the value of which is determined based on the analysis financial market.
In Russian practice, this can be the yield of a term currency deposit offered by Sberbank of Russia. In each case, the analyst determines the risk-free rate individually, but, as a rule, its level is relatively low.
Thus, discounting costs at a risk-free rate makes it possible to calculate their total present value, the value of which allows a more objective assessment of the level of investment return, and is a more correct method in case of making investment decisions with irrelevant (extraordinary) cash flows.
Discounted Payback Period (DPP)
Discounted payback period of investment (Discounted Payback Period, DPP) eliminates the disadvantage of the static payback method and takes into account the time value of money, and the corresponding formula for calculating the discounted payback period, DPP, is:
Obviously, in the case of discounting, the payback period increases, that is, always DPP > PP.
The simplest calculations show that such a technique, under conditions of a low discount rate, which is characteristic of a stable Western economy, improves the result by an imperceptible amount, but for significantly higher rate discounting characteristic of the Russian economy, this gives a significant change in the calculated value of the payback period. In other words, a project that is acceptable under the PP criterion may not be acceptable under the DPP criterion.
When using the PP and DPP criteria in the evaluation of investment projects, decisions can be made based on the following conditions:
a) the project is accepted if the payback takes place;
b) the project is accepted only if the payback period does not exceed the deadline set for a particular company.
In general, the definition of the payback period is of an auxiliary nature with respect to the net present value of the project or the internal rate of return. In addition, the disadvantage of such an indicator as the payback period is that it does not take into account subsequent cash inflows, and therefore may serve as an incorrect criterion for the attractiveness of the project.
Another significant drawback of the "payback period" criterion is that, unlike the NPV indicator, it does not have the property of additivity. In this regard, when considering a combination of projects, this indicator must be handled with care, given this property.
However, the "payback period" criterion is indifferent to the amount of initial investment and does not take into account the absolute volume of investments. Thus, this indicator can only be used to analyze investments with a comparable amount of initial investment.
In some cases, the application of the "payback period" criterion can be decisive for the purposes of making investment decisions. In particular, this can happen if the investment is associated with high risk, and then the shorter the payback period, the more preferable such a project. In addition, the management of the company may have a certain limit on the payback period, and this is primarily due to the problem of liquidity, since the main task of the company is to ensure that investments pay off as soon as possible. Thus, the PP and DPP criteria make it possible to judge the liquidity and riskiness of the project as follows: the shorter the payback period, the less risky the project; the more liquid the project, which has a shorter payback period. It is advisable to apply these criteria when a company is interested in increasing liquidity, as well as in industries where investments are associated with a high level of risk (for example, in industries with a rapid change in technology: computer systems, mobile connection etc.).
Cash flows of investment projects: analysis and evaluation
Relevant cash flows
The most important step in the analysis of an investment project is the assessment of the projected cash flow 12 , consisting (in the most general view) from two elements: required investments (outflows of funds) and cash inflows minus current expenses (inflows of funds).
AT financial analysis it is necessary to carefully consider the distribution of cash flows over time. Profit and loss accounts are not tied to cash flows and therefore do not reflect when exactly during the reporting period there is an inflow or outflow of cash.
When designing cash flow, the time value of money must be taken into account.
To compare multi-temporal values of the cash flow, a discounting mechanism is used, with the help of which all values of the cash flow at various stages of the implementation of the investment project are brought to a certain moment, called the reduction moment. Usually, the moment of reduction coincides with the beginning or end of the basic stage of the investment project, but this is not prerequisite, and any stage at which it is required to evaluate the effectiveness of the project can be chosen as the reduction point.
As noted above, the most important indicator of the project's effectiveness is the net present value. The indicators of net present value and internal rate of return (IRR) make it possible to compare various investment projects with each other in order to choose the most effective one. However, projects with comparable implementation timelines, initial investment volumes and relevant cash flows are subject to such a comparison.
Relevant cash flows are those in which a minus-signed flow changes to a plus-signed flow once. Relevant cash flows are characteristic of standard, typical and most simple investment projects in which the initial investment of capital, that is, the outflow of funds, is followed by long-term receipts, that is, the inflow of funds.
Analysis of the cash flow of an investment project is not limited to studying its structure. It is also important to identify the cash flow, make sure it is relevant/irrelevant, which will ultimately simplify the selection of evaluation indicators and selection criteria, as well as improve the comparability of different projects.
Irrelevant Cash Flows
Irrelevant cash flows are characterized by a situation where the outflow and inflow of capital alternate. In this case, some of the considered analytical indicators with a change in the initial parameters may change in an unexpected direction, that is, the conclusions drawn on their basis may not always be correct.
If we recall that IRR is the root of the equation NPV = 0, and the function NPV = f(i) is an algebraic k-th equation degree, where k is the number of years of project implementation, then, depending on the combination of signs and absolute values of the coefficients, the number of positive roots of the equation can vary from 0 to k. In particular, if the values of the cash flow alternate in sign, several values of the IRR criterion are possible.
If we consider the graph of the function NPV \u003d f (r, Pk), then its different presentation is possible depending on the values of the discount factor and signs of cash flows ("plus" or "minus"). Two most realistic typical situations can be distinguished (Fig. 1).
Reduced types of function graph
NPV = f (r, Pk) correspond to the following situations:
Option 1 - there is an initial investment of capital with subsequent cash inflows;
Option 2 - there is an initial investment of capital, in subsequent years, inflows and outflows of capital alternate.
The first situation is the most typical: it shows that the function NPV = f (r) in this case is decreasing as r increases and has a single value of IRR. For the second situation, the type of graph may be different.
Project efficiency assessment
Consider an example of evaluating an investment project for the construction of a multifunctional complex within the third transport ring.
Assumptions
Any investment project is considered in the context of complex macro- and microeconomic processes. The process of modeling and evaluating an investment project is influenced by many, if not all, factors of the macro- and microenvironment, if it concerns real investments in the construction sector, which will be discussed. It is impossible to take into account absolutely everything, but there are such indicators that can and even need to be taken into account: inflation, the commercial loan rate, the fund's profit share, taxes, the investor's desired profit, and others. It is easy to see that some indicators, such as inflation and taxes, are conditionally constant, that is, their quantitative characteristics can be taken as constant over a certain period of time. Others, like the commercial loan rate, the fund's profit share, the investor's desired return, and others, may vary depending on the "appetite" of the participants. To analyze the effectiveness of the proposed investment project, a model was created in which it is possible to change the above indicators, and the computer automatically recalculates the analytical part, but for this study it is necessary to fix some indicators in the form of economic assumptions 13:
Bank loan interest rate, 27% per annum;
Bank profit share, 0%;
Profit of the right holder, 84%;
Income tax rate, 24%;
Development fee, 3% of revenue;
Marketing costs, from revenue 2%;
Cost of land lease, $91,000/ha per year;
Fixed part of running costs, $15,000 per month.
In addition to the above assumptions, it is worth saying that there are several strategies for the development of the proposed investment project. In order to minimize the risks and a faster return on investment, we propose to consider the situation of financing the project at the expense of 100% of the funds raised, with the parallel sale of the areas under construction as they are built.
Research Logic
To determine investment needs, as well as to analyze the economic efficiency of an investment project, it is necessary to go through several 14 stages:
1) investment forecasting: project estimate;
2) investment forecasting: investment plan;
3) revenue forecast;
4) drawing up a cash flow statement;
5) determination of net present value (NPV) and internal rate of return (IRR);
6) calculation of the payback period of investments (PP), discounted payback period (DPP) and investment profitability index (PI);
7) determination of the need for financing.
Let's take a closer look at the key points.
Description of the investment project
Consider an investment project for the construction of a multifunctional complex within the third transport ring, which is a multi-storey complex on an area of 1.08 hectares with underground parking, offices, retail space, a hotel, a restaurant and apartments.
Evaluation of the effectiveness of the project. Investment Forecasting: Project Estimate
Let us consider a specific example of evaluating the effectiveness of an investment project for the construction of a multifunctional complex in Moscow. We will draw up a project estimate (Table 1).
Preparation of a cash flow statement
Determination of Net Present Value (NPV)
To determine the NPV, the line profit / loss (or cash flow) is taken from the cash flow statement. For clarity, we present a method for calculating NPV.
Calculation of NPV:

conclusions
In the context of the global economic crisis, the construction sector of the Russian economy is experiencing serious difficulties, in particular, access to credit resources is limited even for such large companies like Mirax Group, PIK group of companies, Glavmosstroy. Practically all developers now have to rely exclusively on their own funds, which are generally not enough to implement new and complete existing projects, not to mention those companies that were building exclusively on borrowed funds.
Nevertheless, promising investment projects continue to exist on the market, and the use of the correct methodology for their assessment is still relevant. At the same time, it is necessary, of course, to make adjustments to the values of current indicators for the cost of credit resources, the exchange rate, the discount rate and other indicators, to modernize the general approach to the formation of project financing sources.
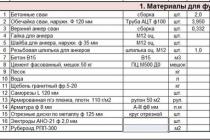
Table 1. Project estimate

Table 2. Cash flow statement
| Cash flow statement | ||||||||
| 1st year | 2nd year | |||||||
| I | II | III | IV | I | II | III | IV | |
| Revenue | ||||||||
| Sale of hotel space | $239 200 000 | |||||||
| Sale of apartments | $54 000 000 | $54 000 000 | $54 000 000 | $54 000 000 | $54 000 000 | $54 000 000 | $54 000 000 | |
| Sale of parking spaces | $17 460 000 | $17 460 000 | $17 460 000 | $17 460 000 | ||||
| Sale of restaurant space | $23 700 000 | |||||||
| Sale of retail space | $3 760 000 | $3 760 000 | $3 760 000 | |||||
| Sale of office space | $5 460 000 | $5 460 000 | $5 460 000 | |||||
| Selling costs | $ (2 143 800) | $ (8 908 800) | $ (2 420 400) | $ (2 607 600) | $ (2 307 600) | $ (1 620 000) | $ (2 143 800) | |
| Net revenue | $69 316 200 | $288 051 200 | $78 259 600 | $84 312 400 | $74 612 400 | $52 380 000 | $69 316 200 | |
| Expenses | ||||||||
| Preparation of a package of documents | $125 598 000 | |||||||
| Construction of hotel areas | $15 946 667 | $15 946 667 | $15 946 667 | |||||
| Construction of apartments | $16 800 000 | $16 800 000 | $16 800 000 | |||||
| Construction of a parking lot | $55 500 000 | |||||||
| Restaurant area construction | $7 900 000 | |||||||
| Construction of retail space | $3 760 000 | |||||||
| Construction of office space | $4 680 000 | |||||||
| Construction of technical premises | $750 000 | $750 000 | $750 000 | $750 000 | $750 000 | $750 000 | $750 000 | $750 000 |
| Preparation for finishing | $628 857 | $628 857 | $628 857 | $628 857 | $628 857 | $628 857 | $628 857 | |
| Finishing of technical premises | $187 500 | $187 500 | $187 500 | $187 500 | $187 500 | $187 500 | $187 500 | $187 500 |
| Finishing of general office and retail space | $1 600 000 | |||||||
| Parking lot decoration | $436 500 | $436 500 | ||||||
| Showroom organization | $900 000 | |||||||
| Marketing costs | $1 386 324 | $5 761 024 | $1 565 192 | $1 686 248 | $1 492 248 | $1 047 600 | $1 386 324 | |
| Getting BTI | $4 402 000 | |||||||
| Current expenses | $15 000 | $15 000 | $15 000 | $15 000 | $15 000 | $15 000 | $15 000 | $15 000 |
| Development Fee | $5 474 610 | $908 725 | $698 671 | $572 796 | $602 028 | $596 208 | $582 869 | $458 090 |
| Interest on borrowed funds | $12 687 409 | $11 115 643 | - | - | - | - | - | |
| Total expenses | $187 961 610 | $46 030 782 | $44 012 162 | $22 086 412 | $23 277 233 | $22 777 413 | $21 631 826 | $17 871 572 |
| $385 649 010 | ||||||||
| Total interest paid | $23 803 052 | |||||||
| Profit Loss | $(187 961 610) | $23 285 418 | $244 039 038 | $56 173 188 | $61 035 167 | $51 834 987 | $30 748 174 | $51 444 628 |
| Cumulative total | $(187 961 610) | $(164 676 192) | $79 362 846 | $135 536 034 | $196 571 200 | $248 406 187 | $279 154 361 | $330 598 990 |
1 - Zlaf V. Evaluation of non-commercial investment projects // New markets. 2002. No. 3.
3 - Zavlin P.N. Estimation of economic efficiency of investment projects: Modern approaches. - St. Petersburg: Nauka, 1995.
4 - Zavlin P.N., Vasiliev A.V. Evaluation of the effectiveness of innovations. - St. Petersburg: Publishing House"Business Press", 1998.
5 - Kovalev V.V. Methods for evaluating investment projects. - M .: Finance and statistics, 2000. S. 54.
6 - Beret V., Havrapek P.M. Guidelines for the preparation of industrial feasibility studies. - M: Interexpert, 1995.
7 - Blech J., Gotze W. Investment calculations/ Edited by A.M. Chuikina, L.A. Galyutina. - Kaliningrad: Amber Tale, 1997.
8 - Foreign investments in St. Petersburg // Economics and life. St. Petersburg regional issue. 1997. No. 6.
9 - Gitmap L.J., Jonk M.D. Fundamentals of investing. - M .: Delo, 1998.
10 - Gazeev M.Kh., Smirnov A.P., Khrychev A.N. Indicators of investment efficiency in market conditions. — M.: PMB VNIIOENGa, 1993.
11 - Financial analysis of the company's activities. - M .: East-service, 1994.
12 - The cash flow of an investment project is the dependence on the time of cash receipts and payments during the implementation of the project that generates it, determined for the entire settlement period covering the time interval from the beginning of the project to its termination (see: "Methodological recommendations for evaluating the effectiveness of investment projects", approved by the Ministry of Economy of the Russian Federation, the Ministry of Finance of the Russian Federation, the Civil Code of the Russian Federation on construction, architectural and housing policy No. VK 477 of 06/21/1999).
13 - All assumptions are based on deep analysis market, using data from well-known analytical companies.
14 - Mindich D.A. Growing business finance. - M .: CJSC "Expert RA", 2007.
Making investment decisions is integral part financial policy any dynamically developing commercial organization, the management of which is aimed at the well-being of the company in the long term.
An analysis of the literature and practice shows that an enterprise cannot, in principle, refuse to invest, since in this case its position will significantly worsen in comparison with competing firms. The implementation of an investment project allows the company to adapt to macroeconomic realities, to changes in the external environment. All commercial enterprises are to one degree or another connected with investment activities, but the adoption of investment decisions differs in the types of investments, the cost of projects, the risks of making a particular decision. That is why the problem effective investment deserves special attention.
The importance of economic analysis for planning and implementing investment activities can hardly be overestimated. At the same time, a special role is played by a preliminary analysis, which is carried out at the stage of development of investment projects and contributes to the adoption of reasonable and justified management decisions.
In domestic and foreign practice, when developing and examining an investment project, its evaluation is carried out on the basis of an analysis of the values of integral indicators, the calculations of which are devoted to a huge amount of literature.
Among the most common methods for evaluating the effectiveness of investment projects, the following should be noted:
1. NPV (Net Present Value) - net present (discounted) value: the difference between discounted cash flows and initial investment;
2. IRR (Internal Rate of Return) - internal rate of return (profitability): the discount rate at which the net present value (NPV) is zero;
3. PI (Profitability Index) - profitability index: the ratio of the reduced income expected from investments to the amount invested capital;
4. DPP (Discounted Payback Period) - discounted payback period: the number of years required to recoup the investment with discounted net cash flows.
When making investment decisions, it should be borne in mind that the implementation of projects is carried out not only taking into account the characteristics of a particular enterprise, but also taking into account the conditions of the external environment in which the organization operates, and the possibility of their changes. This situation leads to the fact that the set of parameters and cash flows of the project are not known in advance and can take on different values, that is, the project has several possible implementation scenarios. In this regard, it becomes necessary to use methods that allow assessing the effectiveness and risks of the project, taking into account changes in the external environment.
But, despite this, in practice, project risks are at best characterized qualitatively, that is, at the level of their enumeration and description. Methods for accounting for uncertainty in project evaluation are not popular with enterprises, which explain this by the lack of the necessary tools or the complexity of calculations. Such an approach is unacceptable, especially in the current conditions of the Russian economy.
The purpose of risk analysis, which acts as a source of uncertainty, is to provide potential project investors with the necessary data to decide on the appropriateness of participation in it and to identify measures to protect against possible financial losses.
Risk analysis usually begins with a qualitative analysis, the purpose of which is to identify risks, which is carried out as follows:
§ identification of all possible risks characterizing the investment project;
§ description of risks;
§ classification and grouping of risks;
§ analysis of initial assumptions.
The risks inherent in investment projects can be classified based on their manifestation at one stage or another of the investment project. In accordance with this, it is possible to single out the risks of the investment phase of the project, which may arise as a result of underfunding of projects, an increase in the cost of capital, the timing of the project, the technical impracticability of the project; risks of the production phase of the project - production and marketing; as well as complex risks, which include managerial, administrative, financial, regional, legal and other types of risks.
The second most complex stage of risk analysis is quantitative risk analysis, the purpose of which is to measure risk.
Quantitative risk analysis is a formalization of the results of a qualitative analysis and determination of the degree of the overall risk of the project.
The most common methods for assessing the risks of investment projects include the following:
§ Sensitivity analysis.
§ Scenario analysis.
§ Simulation modeling.
Sensitivity analysis consists in determining the dependence of the most important economic indicators of the project on changes in the main parameters of the project, which vary within certain limits. The sensitivity score is the percentage change in NPV per 1% change in the input variable. Depending on the value of the sensitivity index, the variables are ranked from the most sensitive to the least sensitive. The higher the sensitivity, the more important the variable is for determining the performance indicator, which must be taken into account when predicting the variables entered for calculation and making a decision on the implementation of an investment project.
Some authors consider sensitivity analysis as the main, simple and widely used method for determining the limits of risk, as well as its reduction in the operational analysis of the enterprise. However, it is not without significant drawbacks:
§ does not allow to calculate the probabilities of changes, as well as the probabilistic indicators of the formation of this particular, and not another, value of the resulting indicator. This method allows you to determine the risk of the project only at certain points;
§ Sensitivity analysis assumes that all variables are unchanged except for one. In reality, this is impossible, since a change in some variables entails a change in others.
It is precisely because of the above disadvantages that the investor should consider sensitivity analysis as a source of information for other methods.
To conduct an analysis with more realistic assumptions about the relationship of input variables, it is necessary to use more accurate methods, one of which is scenario analysis. This method consists in building scenarios for the development of events and calculating the main indicators of the economic efficiency of the project for each scenario. Conclusions are drawn based on the compilation of the obtained calculation results with an assessment of the probability of the scenario. The scenario method allows you to combine the study of the sensitivity of the resulting indicator with the analysis of probabilistic estimates of its performance.
When conducting an analysis using this method, it should be taken into account that scenario analysis is most effective when the number of possible values of the resulting indicator is finite and relatively small. But in practice, opposite cases are very often encountered, characterized by an unlimited number of options for implementing an investment project. In such cases, it is more convenient to use simulation modeling, including its version of the Monte Carlo method.
Simulation modeling is one of the most powerful modern methods for analyzing economic processes and systems. This method is defined as the process of building a model of a real system and setting up experiments on this model in order to study the behavior of the system or evaluate (within the constraints imposed by some criterion or set of criteria) various strategies that ensure the functioning of this system. The Monte Carlo method is a kind of simulation modeling and allows you to take into account the impact of uncertainty on the efficiency of an investment project. This method is based on the fact that, given the known laws of distribution of exogenous variables, it is possible, using a certain technique, to obtain not a single value, but the distribution of the resulting indicator.
Compared to the previously discussed methods, the Monte Carlo method has a number of significant advantages:
§ allows to take into account the maximum possible number of factors;
§ creates an additional opportunity in risk assessment due to the fact that it makes possible the creation of random scenarios;
§ the method reveals the weaknesses of the project and makes it possible to make amendments;
§ can be quite simply implemented in the MS Excel environment;
§ allows you to quantify the risk of an investment project.
These and other advantages of the Monte Carlo method make it one of the better ways evaluation of investment projects.
12. Statistical and dynamic methods of investment analysis: general and Comparative characteristics
The set of methods used to evaluate the effectiveness of investments can be divided into two groups: dynamic (taking into account the time factor) and static (accounting) (Fig. 8.3).
The essence of all evaluation methods is based on the following simple scheme: the initial investment in the implementation of a project generates cash flow CF 1 , CF 2 ,..., CF n . Investments are recognized as effective if this flow is sufficient for:
Return of the initial amount of capital investments;
Ensuring the required return on invested capital.
The most common indicators of the effectiveness of capital investments are:
Payback period (RR);
Accounting rate of return (ARR)\
Net present value of the investment project (NPV);
Internal rate of return (profitability, profitability) (IRR);
Modified internal rate of return (yield, profitability) (MIRR);
Project Profitability Index (PF);
discounted payback period (DPP).
These indicators, as well as the methods corresponding to them, are used in two versions:
To determine the effectiveness of independent investment projects (the so-called absolute efficiency), when it is concluded whether to accept the project or reject it,
To determine the effectiveness of mutually exclusive projects (comparative efficiency), when it is concluded which project to accept from several alternative ones.
static methods. The following methods are used.
□ Payback period of investments (Payback Period- RR). This is one of the simplest and most widely used methods in world practice; it does not imply a temporal ordering of cash receipts and consists in determining the number of years required to fully recover the initial costs, i.e. determining the point at which the cash flow of income equals the sum of the cash flows of costs. Projects with the shortest payback periods are selected. Payback period calculation algorithm (RR) depends on the uniformity of the distribution of projected income from the investment. If the income is evenly distributed over the years, then the payback period is calculated by dividing the one-time costs by the annual income due to them. When a fractional number is received, it is rounded up to the nearest whole number. If profits are unevenly distributed, then the payback period is calculated by directly counting the number of years during which the investment will be repaid with cumulative income. General formula for calculating the indicator RR has the form
Based on the example data, we will calculate the payback period of the project:
The project pays off in 3.4 years. If the investor is satisfied with this period, then the project is accepted for implementation.
The indicator "payback period of investment" is very simple to calculate, however, it has a number of disadvantages that must be taken into account in the analysis.
First, it ignores cash receipts after the project's payback period has expired. Second, because the method is based on undiscounted estimates, it does not distinguish between projects with the same amount of cumulative returns, but different distribution them by year. It does not take into account the possibilities of reinvestment of income and the time value of money. Therefore, projects with equal payback periods, but different time structure of income are recognized as equivalent.
This method allows you to judge the liquidity and riskiness of the project, since long-term payback means a long-term immobilization of funds (reduced project liquidity) and increased riskiness of the project. There are a number of situations in which it may be appropriate to apply the payback method. In particular, this is a situation where the company's management is more concerned with solving the problem of liquidity, rather than the profitability of the project - the main thing is that the investment pays off as soon as possible. The method is also good in a situation where investments are associated with a high degree of risk, so the shorter the payback period, the less risky the project is considered. Method RR is successfully used for quick rejection of projects, as well as in conditions of high inflation, political instability or a shortage of liquid funds: these circumstances orient the enterprise to receive maximum income in the shortest possible time.
□ Method of simple rate of return (Accounting Rate of Return - ARR). When using this method, the average net accounting profit over the life of the project is compared with the average investment (costs of fixed and working capital) in the project.
The method is easy to understand and includes simple calculations, so it can be used to quickly reject projects. However, a significant drawback is that the non-monetary (hidden) nature of some types of costs (for example, depreciation) and the tax savings associated with this are ignored; income from the liquidation of old assets being replaced by new ones; opportunities for reinvestment of income received and the time value of money. The method does not make it possible to judge the preference of one of the projects that have the same simple accounting rate of return, but different sizes of average investments:
where R b - net accounting profit from the project;
I 0 - investment.
dynamic methods. The international practice of assessing the effectiveness of investments is based on the concept of the time value of money and is based on the following principles.
1. The effectiveness of the use of invested capital is assessed by comparing the cash flow (cash flow), which is formed in the process of implementing the investment project and the original investment. The project is recognized as effective if the return of the initial investment amount and the required return for the investors who provided the capital are ensured.
2. The invested capital, like the cash flow, is adjusted to the present time or to a certain settlement year, which, as a rule, precedes the start of the project.
3. Discounting of capital investments and cash flows is carried out at different discount rates, which are determined depending on the characteristics of investment projects. When determining the discount rate, the structure of investments and the cost of individual components of capital are taken into account.
Dynamic methods that allow taking into account the time factor reflect the most modern approaches to assessing the effectiveness of investments and prevail in the practice of large and medium-sized enterprises in developed countries. In the economic practice of Russia, the use of these methods is also due to the high level of inflation. These methods are often called discount methods, since they are based on determining the current size (ie, discounting) of cash flows associated with the implementation of an investment project.
In doing so, the following assumptions are made:
Cash flows at the end (beginning) of each project implementation period are known;
An estimate is determined, expressed as an interest rate (discount rate), according to which funds can be invested in this project. As such an estimate, the average or marginal cost of capital for the enterprise is usually used; interest rates on long-term loans; the required rate of return on invested funds, etc. The assessment is significantly affected by inflation and risk.
Determination of the discount rate. Calculations related to investment planning show that, in general, investments create a stream of payments that must be compared with the initial costs. The simplest form of such flows to be analyzed are annual financial rents, i.e. certain amounts money paid every year for a fixed number of years in equal or uneven installments.
In relation to investment projects, the interest rate (discount rate) is called barrier. It determines the financial return that an investor expects from his investment. According to financial management theory, this return has two components: the risk-free rate and the insurance premium. In general, this formula looks like this:
Required return = Risk free rate + Insurance premium.
The risk-free rate is the base rate. It represents the minimum acceptable return on investment in the absence of almost all risks. This rate is usually a few points above the rate of inflation, which prevents the erosion of the investor's capital and takes into account liquidity considerations. Investors also demand an insurance premium as a payment for financing a firm exposed to risks in the process of implementing investment projects. The numerical expression of the level of risk of an enterprise is obtained by a combination of the average value of the cost of equity and the cost of debt, which is defined as weighted average cost of capital- WACC). In many enterprises, the barrier rate is set by financial managers, which is constant for a certain period of time. One of the main factors affecting barrier rates is general situation with interest rates. The financial manager must keep a close eye on the benchmark interest rate and, as it rises or falls, adjust the barrier rates accordingly. Overestimated or understated rates lead to a deterioration in the affairs of the enterprise.
Net present value (Net Present Value - NPV). This investment evaluation criterion belongs to the group of discounted cash flow methods, or DCF methods. It is based on a comparison of the amount of investment costs (/0) and the total amount of time-adjusted future cash flows generated by it over the forecast period. For a given discount rate (coefficient r, set by the analyst (investor) independently based on the annual percentage of return that he wants or can have on the capital he invests), it is possible to determine the current value of all outflows and inflows of funds during the economic life of the project, and compare them with each other. The result of such a comparison will be a positive or negative value (net inflow or net outflow cash), which shows whether or not the project satisfies the accepted discount rate.
The net present value of a project is determined by the following formula:
where r- discount rate;
n- number of project implementation periods;
NCF t- net cash flow in the period t,
Σ CIF t- total income from the project in period r,
Σ COF t - total payments for the project in the period t
If the net present value of the cash flow calculated in this way is greater than zero (NPV > 0), then during its economic life the project will recover the initial costs and provide a profit according to the specified standard G, as well as some reserve equal to NPV. negative NPV shows that the given rate of return is not provided and the project is unprofitable. At NPV= 0 the project only pays for the costs incurred, but does not generate income. However, the project NPV= 0 still has an additional argument in its favor - if the project is implemented, production volumes will increase, i.e. the company will grow in scale (which is often seen as a positive trend).
General rule for NPV: if NPV> 0, then the project is accepted, otherwise it should be rejected.
When forecasting income by years, it is necessary to take into account, if possible, all types of income, both industrial and non-productive, that may be associated with this project. So, if at the end of the project implementation period it is planned to receive funds in the form of the salvage value of equipment or the release of part of working capital, they should be taken into account as income of the corresponding periods.
The method is implemented in three steps.
Step 1. The current value of each cash flow, input and output, is determined.
Step 2 All discounted values of cash flow elements are summed up and the criterion is determined NPV.
Step 3/7 a decision is made:
For a single project - if NPV > 0, then the project is accepted;
13. Dynamic methods for analyzing the commercial effectiveness of an investment project: the problem of substantiating the discount rate of the project
When evaluating the economic efficiency of projects or with any investment in any activity, the problem of comparing funds paid or received at different points in time constantly arises. The problem lies not only in the fact that investors, having free cash, have alternative opportunities for their use and profit, but also in the unequal value of cash over time. So, one hundred rubles, for example, used today for the production of products, is not identical to one hundred rubles in a year or two, three, etc. different attitude towards the same sum of money caused not only by inflation or the risk of investment, but also by the time during which this money can bring to their owner highest income.
To evaluate the return on investment over time, use discounting- the process of bringing multi-temporal cash flows (receipts and payments) to a single point in time. The name of the term comes from the word "discount" - a discount from the price of a debt obligation in case of an advance payment of interest for using a loan.
If for some period of time income exceeds costs, one usually speaks of net income(English net benefits), or positive cash flows(English positive cash flows); if the costs exceed the income, then they are called net cost(English net expenditure), or cash outflows(English cash outlay).
To make management decisions on the choice of an investment project, the following indicators based on estimates can be used:
Net income
net present value ( NPV) or integral effect;
profitability index (ID);
The internal rate of return (GNI);
· payback period;
Other indicators reflecting the interests of the participants or the specifics of the project.
To use indicators for comparing projects, they must be brought into a comparable form.
Net undiscounted income(other names RR, NetValue, NV) called the accumulated net income (balance of real money, effect) for the billing period, calculated by the formula:
where ft- effect (net income, real money balance) on m-th step, and the amount applies to all steps in the billing period.
Net present value (NPV, cumulative effect, net present value, NetPresentValue, NPV) - accumulated discounted net income (balance of real money, effect) for the entire billing period, calculated by the formula:
where ft- effect on t step; α m- discount coefficient; γ m- distribution coefficient, and the amount applies to all steps in the billing period.
If during the billing period there is no inflationary change in prices or the calculation is made in basic prices, then NPV for a constant discount rate is calculated by the formula:
where Rt- the results achieved on t-th calculation step; Zt - costs incurred at the same step; T- horizon of planning, calculation (equal to the number of the calculation step at which the liquidation of the object is carried out); E- rate of return (rate of discount); (Rt - Zt) \u003d Et - effect achieved on t-th step (analogue BH).
If the discount rate changes over time, then
where P- work; Et- rate of return on t- calculation step.
Difference BH - NPV sometimes called project discount. If a NPV of the investment project is positive, the project is effective (at a given discount rate) and the issue of its adoption can be considered. The more NPV, the more effective the project. If the investment project is implemented with a negative NPV, the investor will incur losses, i.e. the project is inefficient.
In practice, a modified formula is often used to determine NPV. For this, from the composition Zt exclude capital investments and designate them: Kt- capital investment in t- mstep; TO - amount of discounted capital investments, i.e.:
If accept Zt*- costs for t-th step, provided that they do not include capital investments, then formula (19.30) for NPV is written in the form
and expresses the difference between the sum of the given effects and capital investments. It is obvious that if NPV > 0, then the project should be recommended for implementation; if NPV<
0, the project should be rejected; at NPV= 0 the project is neither profitable nor unprofitable.
If we consider several mutually exclusive projects, then profitable from the standpoint of profitability (according to the criterion financial efficiency) will be the project with NPV more. The discount rate or rate of return E they should be the same. The profitability of each project should be determined by a condition of the type
where T - calculation horizon; Et \u003d Rt - Zt, i.e. the effects achieved on t-th calculation step; E- see formula (19.13); TO - capital investments at the zero calculation step.
As a matter of fact, the results obtained by formula (19.34) can be interpreted as reduction of multi-temporal effects to the initial step (t ³ 0). Technically, it is done by multiplying the effects Et on the discount factor at, which for a constant discount rate E defined as
where t- step number, t = 0, 1, 2, ... T.
The higher the rate or rate of return (discount) E, the more stringent conditions the project must satisfy in order to be truly effective.
If we remove the restriction according to which investments occur only at the zero moment of time, assuming the postmerando flow, and assume that at Et capital investments are not included W*), then formula (19.34) admits the following generalization: the project is profitable if
where To calculated by formula (19.32).
It should be noted that the situation with the project at NPV= 0 is of some interest, since it still has an additional argument in its favor. If it is introduced, then the scale of production will increase and, accordingly, the size of the enterprise will increase, which will entail additional benefits for its employees. On the other hand NPV= 0 means that investments are just as profitable as placing them in other financial instruments of the market.
However, despite certain advantages NPV, accepted as an optimality criterion in evaluating the effectiveness of investment projects, it has a number of disadvantages. First, if an error is made in the forecast of cash flow or the discount factor, then the project, which was considered as profitable, may become unprofitable. Secondly, in reality, the effectiveness of a project depends largely on its scale and risk. Moreover, the relationship between NPV and E non-linear. Therefore, when evaluating the effectiveness of IP, it is necessary to calculate not only NPV, but also the yield index ID, and the internal rate of return, which, depending on the riskiness of the project, are more preferable.
In foreign economic literature the corresponding indicator is called NetPresentValue (NPV)- net present value. It is calculated by the formula:
where CIFT- cash receipts for t- calculation step; COFT - cash payments for t-th calculation step; T- duration of the investment period; R- rate of return.
If investments in the project are made at a time, then the expression (19.36) can be represented as:
where NCFT-net cash flow t-th calculation step; I
Positive value NPV indicates the expediency of making a decision on financing the project. When comparing alternative projects, the project with the greatest economic effect is considered economically viable.
Comparing the possible options for the investor's behavior over the entire period of time, we find that his participation in the project can change the amount of funds in his accounts by an amount that is called the compounded effect in the literature (net compounded income - FKD, NetFutureValue). It can be negative in case of irrational use of resources or termination of the project and positive. Based on the negative and positive signs of the obtained compounded effect, a decision is made to participate in the project.
Yield Indices (ID) is the ratio of the sum of the reduced effects to the amount of capital investments. They can be calculated for discounted and undiscounted cash flows:
When evaluating the effectiveness of projects, the following indices can be used:
· Return on Cost Index (IRI) - this is the ratio of the amount of cash inflows (accumulated receipts) to the amount of cash outflows (accumulated payments).
· Discounted Cost Return Index (IDIR) is the ratio of discounted cash inflows to cash outflows.
· Return on investment index (IRI) is the ratio of the sum of elements from operating activities to the absolute value of the sum of elements of cash flow from investment activities. It is equal to the value of the ratio increased by one BH to the accumulated investment.
· Discounted Investment Return Index (IDDI) - is the ratio of the sum of discounted cash flow elements from operating activities to investment activities. It is equal to the value of the ratio increased by one NPV to the accumulated discounted investment.
When calculating ID and IDD either all capital investments for the billing period, including investments in the replacement of retired fixed assets, or only initial capital investments made before the enterprise is put into operation can be taken into account. In this case, the corresponding indicators will have different values.
As you can see, the yield index ID closely associated with NPV. It is built from the same elements. If a NPV is positive, then ID > 1 and vice versa. If a ID > 1, the project is effective if ID< 1 - неэффективен.
There is also a corresponding indicator in foreign practice Ptofitability Index (PI), considered by the formula:
where NCFT-net cash flow t- calculation step; R- rate of return; I- one-time investment in the project.
Unlike net discounted income, the profitability index is a relative indicator that characterizes the level of income per unit of costs. The higher the return of each ruble invested in this project, the greater the value of this indicator. For all equal values NPV the profitability index gives reason to choose the project that has the highest value.
Internal rate of return or profitability (IRR) is the discount rate Evn, at which the reduced effects are equal to the reduced capital investments. This is such a discount rate at which the integral effect of the project, for example NPV, becomes zero.
To obtain Evn (VID), you need to solve the following equation:
If the entire project is carried out only with borrowed funds, then GNI is equal to the highest interest rate at which a loan can be borrowed in order to be able to pay off from the proceeds of the project.
The value of the internal rate of return GNI reflects:
economic disparity of costs, results and effects at different times - the profitability of the later implementation of costs and the earlier receipt of useful results;
· the minimum allowable return on invested capital, at which the investor would prefer participation in the project to an alternative investment of the same funds in another project with a comparable degree of risk;
financial market conditions, the availability of alternative and affordable investment opportunities;
· the uncertainty of the conditions for the implementation of the project and, in particular, the degree of risk associated with participation in its implementation;
· the possibility of setting limits on "concessions" in order to obtain a certain gain in terms of other indicators.
advantage GNI is that the project participant does not have to define his own individual rate discount in advance. He defines GNI, i.e., it calculates the efficiency of the invested capital, and then makes a decision using its value.
If, however, we take as a basis the indicator characterizing the weighted average price of capital, as indicated earlier (see formula 19.12), GNI will consist in the fact that the enterprise can make any investment decisions, the level of profitability of which is not lower than E. It is with the index E compare GNI, calculated for a particular project.
If a GNI > E, then the project should be recommended for implementation; if GNI< Е
the project should be rejected; at GNI= E, The project is neither profitable nor unprofitable.
However, if we select projects to the maximum GNI, Benefits may come from projects that are profitable in terms of the efficiency of the capital used, but are small and therefore have little effect.
Value GNI depends not only on the ratio of capital investments and income from the project, but also on their distribution over time. The longer the process of obtaining income is extended in time, the lower the value GNI.
There is also another disadvantage GNI, associated with its absence in a number of projects. On the other hand, if GNI is, then the whole dependence curve NPV from E has a "non-standard" form, passing through a negative value at E= 0. In such cases, transparent economic sense GNI is lost, and the requirement E > GNI as a condition for positivity NPV becomes incorrect. Yes, even in cases where NPV (E= 0) > 0 may be difficult to use in practice GNI, if the equation NPV (E) = O has several positive roots and the value of the first root is small.
Since in practice it is difficult to calculate the internal rate of return, the calculation method is used NPV at different discount rates. Wherein E, at which the graph will cross the x-axis, as shown in Fig. 19.4, and determines the desired value of the internal rate of return of the project when NPV= 0, and for large values E- negative. Assessment of the degree of sustainability IP determined by the difference GND - E.
An interpolation calculation formula can also be used GNI:
where aw and en- coefficients of increasing flows for the upper and lower values of the rates of return; a - flow increase factor, for which the rate is determined; iv and in- or rather, the lower value of the rates of return.
The value of the internal rate of return can be obtained approximately by the iteration method.
Dependency Diagram NPV from E shown in fig. 19.5.
The function is "smoothed" with two rates E. GNI calculated to the third decimal place. The curvature does not affect the yield estimation results so much.
There are a number of other evaluation features GNI. So, when defining GNI no discount rate required. At the same time, the discount rate reflects the profitability of alternative investment directions. Comparison GNI with the discount rate allows you to evaluate the "margin of safety" of the project, so that a large difference between these values indicates a certain stability of the project.
In foreign practice, this indicator is called InternalRateofReturn-IRR, i.e. the calculated rate of interest, or cost-benefit method. It is used as the first step in financial analysis IP. At the same time, projects with an internal rate of return of 15-20% are selected.
In some cases, a simple ranking of projects based on estimates NPV does not allow you to choose the best solution, because the life of investment projects are different. Therefore, to choose best project, uses an equivalent annuity (eng. equivalentannuity). At the same time, the method for calculating the equivalent annuity does not replace the method for determining NPV. It simply facilitates the solution of the problem of choosing from the compared projects the best according to the maximum criterion. NPV, which should correspond to the largest value of the annuity, i.e., all cash receipts.
In real life, other situations are quite possible when the calculations of the effectiveness of investment projects need some adjustment, associated, on the one hand, with the influence of many additional factors and conditions, and, on the other hand, with insufficient information for a reliable assessment. Science and practice have developed certain rules for making decisions on investing in projects, taking into account these circumstances.
The concept, content and methodology for the formation of cash flows of an investment project
CASH FLOW is the difference between the income and costs of an economic entity (usually a company), expressed as the difference between payments received and payments made. Overall, this is the amount retained earnings firm and its depreciation, saved to form own source cash for the future renewal of the fixed capital. In other words, C.p. is the net amount of money actually received by the firm in a given period. In many translated works, this concept is expressed by the terms “cash flow” or “cash flow”, which is clearly unfortunate, since the words cash in English and “cash” in Russian are very different in terms of the terms they cover. For example, D. p. includes depreciation charges or changes in entries in bank accounts firms (in case of non-cash payments): neither one nor the other has anything to do with cash in the conventional sense.
The future success of the company largely depends on how accurately the economic effect of the investment project (IP) is calculated. At the same time, one of the most difficult tasks is the correct assessment of the expected cash flow. If it is calculated incorrectly, then any IP assessment method will give an incorrect result, which is why effective project can be rejected as unprofitable, and economically unprofitable is taken as super-profitable. That is why it is important to correctly plan the company's cash flow. Under the cash flow (cash flow) of the investment project understand the receipts and payments of funds associated exclusively with the implementation of this project. Project cash flows do not include cash flows arising from the current activities of the enterprise. The cash flow of an investment project is the time dependence of cash receipts (inflows) and payments (outflows) during the implementation of the project, determined for the entire billing period. The effectiveness of the IP is evaluated during the billing period, covering the time interval from the start of the project to its termination. The calculation period is divided into steps - segments within which the data used to evaluate financial performance is aggregated. At each step, the value of the cash flow is characterized by: - an inflow equal to the amount of cash receipts (or results in value terms) at this step; - outflow equal to payments at this step; - balance (effect) equal to the difference between inflow and outflow. Cash flow usually consists of cash flows from certain types activities: a) cash flow from operating activities; b) cash flow from investment activities; c) cash flow from financial activities. Cash flow from operating activities includes cash receipts from the sale of goods, works and services, as well as advances from buyers and customers. Payments for raw materials, materials, utility bills, wage payments, paid taxes and fees, etc. are shown as cash outflows. When investing, cash flows associated with the acquisition and sale of long-term property, that is, fixed assets and intangible assets. Financial activities involve inflows and outflows of cash on credits, loans, issues valuable papers etc. Net cash flow is the sum of cash flows from operating, investing and financing activities. In other words, it is the difference between the sum of all cash receipts and the sum of all payments for the same period. It is the net cash flows of different periods that are discounted when evaluating the effectiveness of the project. At the initial stage of the project (investment period), cash flows, as a rule, turn out to be negative. This reflects the outflow of resources that occurs in connection with the creation of conditions for subsequent activities (for example, the acquisition non-current assets and the formation of net working capital). After the completion of the investment and the beginning of the operating period associated with the start of the operation of non-current assets, the amount of cash flow, as a rule, becomes positive. Additional revenue from the sale of products, as well as additional production costs incurred during the implementation of the project, can be both positive and negative values. Technically, the task of investment analysis is to determine what will be the amount of cash flows on a cumulative basis at the end of the established research horizon. In particular, it is fundamentally important whether it will be positive. Cash flows can be expressed in current, forecast and deflated prices. Current prices are prices excluding inflation. Forecast prices are prices that are expected (taking into account inflation) at future calculation steps. Deflated prices are forecast prices reduced to the price level of a fixed point in time by dividing by a common underlying inflation index. Along with cash flows, when evaluating an investment project, the accumulated (cumulative) cash flow is also used. Its characteristics are cumulative inflow, cumulative outflow and cumulative balance (cumulative effect). These indicators are determined at each step of the billing period as the sum of the relevant characteristics of the cash flow for a given and all previous steps.
MINISTRY OF COMMUNICATIONS OF THE RUSSIAN FEDERATION
FAR EASTERN STATE UNIVERSITY OF TRANSPORTATION
Department: Finance and credit
Test
By discipline: Investment economics
Khabarovsk 2002
Introduction
1. The concept of effect and efficiency. Investment project performance indicators
2. The procedure for selecting investment projects
3. Problem solving
Conclusion
List of sources used
INTRODUCTION
Investment activity is inherent in any enterprise to one degree or another. Making an investment decision is impossible without taking into account the following factors: the type of investment, the cost of the investment project, the multiplicity of available projects, the limited financial resources available for investment, the risk associated with making a particular decision, etc.
The reasons for the need for investment may be different, but in general they can be divided into three types: updating the existing material and technical base, increasing the volume of production activities, and developing new types of activities. The degree of responsibility for the adoption of an investment project within a particular direction is different. So, when it comes to replacing existing production capacity, the decision can be made quite painlessly, since the management of the enterprise clearly understands the volume and with what characteristics new fixed assets are needed. The task becomes more complicated when it comes to investments related to the expansion of the main activity, since in this case it is necessary to take into account a number of new factors: the possibility of changing the position of the company in the goods market, the availability of additional volumes of material, labor and financial resources, the possibility of developing new markets, etc. .
Obviously, the question of the size of the proposed investment is important. Thus, the level of responsibility associated with the adoption of projects worth 1 million rubles. and 100 million rubles, different. Therefore, the depth of the analytical study of the economic side of the project, which precedes the decision, should also be different. In addition, in many firms, the practice of differentiating the right to make decisions of an investment nature is becoming commonplace, i.e., it is limited maximum value investment, in which one or another leader can make independent decisions.
Often decisions must be made in an environment where there are a number of alternative or mutually independent projects. In this case, it is necessary to make a choice of one or more projects based on some criteria. It is obvious that there may be several such criteria, and the probability that one project will be preferable to others according to all criteria is, as a rule, much less than one.
1. The concept of effect and efficiency. Investment project performance indicators
The effectiveness of the project is characterized by a system of indicators that reflect the ratio of costs and results in relation to the interests of its participants.
The following indicators of the effectiveness of the investment project differ:
· indicators of commercial (financial) efficiency, taking into account the financial consequences of the project implementation for its direct participants;
· indicators of budgetary efficiency, reflecting the financial implications of the project for the federal, regional or local budget;
· indicators of economic efficiency that take into account the costs and results associated with the implementation of the project, which go beyond the direct financial interests of the participants in the investment project and allow for cost measurement. For large-scale (significantly affecting the interests of the city, region or the whole of Russia) projects, it is recommended to evaluate the economic efficiency.
Consider the main performance indicators of investment projects.
A measure of net present value.
This method is based on comparing the value of the original investment (IC) with the total discounted net cash flow generated by it over the forecast period. Since cash inflows are spread over time, they are discounted by a factor r set by the analyst (investor) on their own based on the annual percentage return that they want or can have on the capital they invest.
Suppose a forecast is made that an investment (IC) will generate, over n years, annual returns of P 1 , P 2 , ..., P n . The total accumulated value of discounted income (PV) and the net present effect (NPV) are respectively calculated by the formulas:
Obviously, if: NPV > 0, then the project should be accepted;
NPV< 0, то проект следует отвергнуть;
NPV = 0, then the project is neither profitable nor unprofitable.
When forecasting income by years, it is necessary to take into account, if possible, all types of income, both industrial and non-productive, that may be associated with this project. So, if at the end of the project implementation period it is planned to receive funds in the form of the salvage value of equipment or the release of part of working capital, they should be taken into account as income of the corresponding periods.
If the project involves not a one-time investment, but a consistent investment of financial resources over m years, then the formula for calculating NPV is modified as follows:
where i is the projected average inflation rate.
Internal rate of return.
The rate of return on investment (IRR) is understood as the value of the discount factor at which the NPV of the project is zero:
IRR = r, where NPV = f(r) = 0.
The meaning of calculating this ratio when analyzing the effectiveness of planned investments is as follows: IRR shows the maximum allowable relative level of expenses that can be associated with a given project. For example, if the project is fully financed by a loan from a commercial bank, then the IRR value shows the upper limit of the acceptable level of the bank interest rate, the excess of which makes the project unprofitable.
In practice, any enterprise finances its activities, including investment, from various sources. As a payment for the use of financial resources advanced to the activity of the enterprise, it pays interest, dividends, remuneration, etc., i.e. incurs some reasonable costs to maintain its economic potential. An indicator that characterizes the relative level of these costs can be called the "price" of advanced capital (CC). This indicator reflects the minimum return on the capital invested in its activities, its profitability, which has developed at the enterprise, and is calculated using the arithmetic weighted average formula.
The economic meaning of this indicator is as follows: an enterprise can make any investment decisions, the level of profitability of which is not lower than the current value of the CC indicator (or the price of the source of funds for this project, if it has a target source). It is with him that the IRR indicator calculated for a specific project is compared, while the relationship between them is as follows.
If: IRR > CC. then the project should be accepted;
IRR< CC, то проект следует отвергнуть;
IRR = CC, then the project is neither profitable nor unprofitable.
where r 1 is the value of the tabulated discount factor at which f(r 1)>0 (f(r 1)<0);
r 2 - the value of the tabulated discount factor at which f(r 2)<О (f(r 2)>0).
The calculation accuracy is inversely proportional to the length of the interval (r 1 ,r 2), and the best approximation using tabulated values is achieved when the length of the interval is minimal (equal to 1%), i.e. r 1 and r 2 - the nearest to each other values of the discount coefficient that satisfy the conditions (in case of changing the sign of the function from "+" to "-"):
r 1 - the value of the tabulated discount factor, minimizing the positive value of the NPV indicator, i.e. f(r 1)=min r (f(r)>0);
r 2 - the value of the tabulated discount factor, maximizing the negative value of the NPV indicator, i.e. f(r 2)=max r (f(r)<0}.
By mutual replacement of the coefficients r 1 and r 2, similar conditions are written for the situation when the function changes sign from "-" to "+".
Payback period.
This method is one of the simplest and widely used in the world accounting and analytical practice; it does not imply a temporal ordering of cash receipts. The algorithm for calculating the payback period (PP) depends on the uniformity of the distribution of projected income from the investment. If the income is evenly distributed over the years, then the payback period is calculated by dividing the one-time costs by the amount of annual income due to them. When a fractional number is received, it is rounded up to the nearest whole number. If profits are unevenly distributed, then the payback period is calculated by directly counting the number of years during which the investment will be repaid with cumulative income. The general formula for calculating the PP indicator is:
PP=n, at which.
Some experts still recommend taking into account the time aspect when calculating the PP indicator. In this case, the cash flows discounted by the "price" of the advanced capital are taken into account. Obviously, the payback period is increasing.
profitability index.
This method of evaluating the effectiveness of a project is essentially a consequence of the net present value method. Profitability Index (PI) is calculated using the formula
Obviously, if: P1 > 1, then the project should be accepted;
P1< 1, то проект следует отвергнуть;
P1 = 1, then the project is neither profitable nor unprofitable.
Unlike the net present effect, the profitability index is a relative indicator. Due to this, it is very convenient when choosing one project from a number of alternative ones that have approximately the same NPV values. or when completing an investment portfolio with the maximum total NPV value.
Investment efficiency ratio.
This method has two character traits: firstly, it does not involve discounting income indicators; secondly, income is characterized by the net profit indicator PN (balance sheet profit minus deductions to the budget). The calculation algorithm is extremely simple, which predetermines the widespread use of this indicator in practice: the investment efficiency ratio (ARR) is calculated by dividing the average annual profit PN by the average investment value (the coefficient is taken as a percentage). The average investment is found by dividing the initial amount of capital investments by two, if it is assumed that after the expiration of the analyzed project, all capital costs will be written off; if residual or salvage value (RV) is allowed, its valuation should be excluded.
This indicator is compared with the ratio of return on capital advanced, calculated by dividing the total net profit of the enterprise by the total amount of funds advanced into its activities (the result of the average net balance).
The method based on the investment efficiency ratio also has a number of significant drawbacks, mainly due to the fact that it does not take into account the time component of cash flows. In particular, the method does not distinguish between projects with the same amount of average annual profit, but a varying amount of profit over the years, as well as between projects with the same average annual profit, but generated over a different number of years. etc.
2. The procedure for selecting investment projects
All enterprises in one way or another are connected with investment activity. Making decisions on investment projects is complicated by various factors: the type of investment, the cost of the investment project, the multiplicity of available projects, the limited financial resources available for investment, the risk associated with making a particular decision.
The reasons for the need for investment may be different, but in general they can be divided into three types: updating the existing material and technical base, increasing the volume production activities, development of new activities. The degree of responsibility for the adoption of an investment project within a particular direction is different. So, if we are talking about replacing existing production capacities, the decision can be made quite painlessly, since the company's management clearly understands the volume and with what characteristics new fixed assets are needed. The task becomes more complicated when it comes to investments related to the expansion of the main activity, since in this case it is necessary to take into account a number of new factors: the possibility of changing the position of the company in the goods market, the availability of additional volumes of material, labor and financial resources, the possibility of developing new markets, etc. d.
Often decisions must be made in an environment where there are a number of alternative or mutually independent projects. In this case, it is necessary to make a choice of one or more projects based on some criteria. Obviously, there may be several criteria, and the probability that one project will be preferable to others according to all criteria is, as a rule, much less than one.
In a market economy, there are many opportunities for investment. However, any enterprise has limited financial resources available for investment. Therefore, the task of optimizing the investment portfolio arises.
When selecting investment projects, the economic efficiency of the project is taken into account, based on the following main criteria:
· the volume of output (in value and physical terms);
· financial results;
Availability of markets for products;
profitability of production;
return on investment;
· volume of invested funds;
the payback period of the project;
net income, internal rate of return;
social efficiency of the project, based on the following main criteria:
the number of new jobs;
the number of social problems being solved;
· wage level;
· environmental Safety.
For applicants for support from the administration of the Khabarovsk Territory in the form of state guarantees of the Khabarovsk Territory or regional investment resources based on the "Regulations on the procedure for conducting competitive selection and examination of investment projects, the implementation of which requires state support from the Administration of the Khabarovsk Territory", approved by the Decree of the head of the administration of the Khabarovsk Territory dated July 26, 2001, No. 315, additional criteria are established:
· guarantees of return of borrowed funds and interest for the use of borrowed funds;
ensuring risks of non-return.
When selecting investment projects, preference is given to applicants:
having a stable financial position;
· do not have debts on taxes and dues to the budget of the region;
· having a certificate of a law-abiding taxpayer of the Khabarovsk Territory;
providing for the financing of an investment project at the expense of own funds in the amount of at least 20 percent;
· Winners and laureates of the regional competition "Entrepreneur of the Year".
3. Problem solving
Task #1
Condition:
Exercise: determine the cost-effectiveness of the proposed equipment renewal project, calculate the internal rate of return on investment, the return period for one-time costs.
Solution:
1. determination of the economic efficiency of the project.
The coefficient of economic efficiency is equal to:
ARR = (3750/5) / = 1.07. Therefore, the project is effective.
2. calculation of the internal rate of return.
Table 3.1.
Initial data for calculating the IRR indicator.
Based on the calculations given in Table. 3.1, we can conclude that the function NPV=f(r) changes its sign on the interval (41%,42%).
IRR = 41 + * (41 - 42) = 41.2%
3. determination of the period for the return of one-time costs.
Investments amount to 18530 million rubles. in year 0. The income will cover the investment for 2 years. For the first year, revenues amount to 900 million rubles.
For 2 years you need to cover:
1600 - 900 = 700 million rubles,
700 / 800 = 0.875 which is 10.5 months.
Task #2
Condition:
Exercise: Determine the economic efficiency of the introduction of self-propelled machines with a walkie-talkie at the PTO.
Solution:
1. Definition of economic efficiency:
In connection with changing operating costs and capital investments, it is advisable to determine the effectiveness of the use of mobile machines with a walkie-talkie by the amount of savings in reduced costs using the following formula:
ΔЗ = ΔEgod + En * ΔК,
where ΔEgo is the total savings in operating costs as a result of the use of mobile machines;
Yen - standard of comparative economic efficiency, = 0.15;
ΔК is the saving of capital investments in the locomotive fleet.
1.1. Determination of total operating cost savings:
ΔEgo \u003d ΔE + ΔFZP + ΔEo - ΔEdop,
where ΔE is the annual savings in operating costs;
ΔFZP - savings in the wage fund;
ΔEo - reduction of a part of the main general and general expenses associated with the cost of issuing, wearing out uniforms, safety and industrial sanitation as a result of a reduction in the number of staff, at the rate of 300 rubles. per year for 1 person;
ΔEdop - savings in additional operating costs.
ΔE \u003d (1l-h * ΔΣt + 1b-h * ΔΣMt + bet * 1et * ΣM + 1v-h * ΔΣt * M * m) * 365,
where 1l-h is the consumption rate for a locomotive - an hour, = 5.112 rubles;
1b-h - expenditure rate for a brigade - an hour for locomotive crews, \u003d 33.72 rubles;
1 w-h - the cost rate for the car - hour, = 1.485 rubles;
1 floor - the cost of 1 kWh of electricity (1 kg of fuel), = 400 rubles.
bet - hourly consumption of electricity (fuel) when the locomotive is parked, = 55 kWh;
m is the composition of the train.
Hence, ΔE \u003d (5.112 * 0.1 + 33.72 * 75 * 0.1 + 55 * 400 * 75 + 1.485 * 0.1 * 75 * 50) * 365 \u003d 602545754 rubles.
Determining the volume of the reduction in the wage fund as a result of reducing the labor intensity of work:
where 1.385 is the coefficient taking into account social insurance contributions;
1.1 – replacement factor;
Z - average monthly salary, 1500 rubles.
ΔFZP \u003d 15 * 1500 * 12 * 1.385 * 1.1 \u003d 411345 rubles.
ΔEo \u003d 300 * 15 \u003d 4500 rubles.
ΔEdop = Ea + Em + Ep.
Ea - increase in depreciation charges,
Ea \u003d (Km * Cm * a) / 100,
where Km is the number of mobile vehicles;
Cm - the cost of the car, 30.5 thousand rubles;
A is the depreciation rate, 9.9%.
Ea \u003d (2 * 30.5 * 9.9) / 100 \u003d 6000 rubles.
Em - the cost of the current maintenance of cars:
Em \u003d 2000 * 2 + 30500 * 0.05 * 2 \u003d 7050 rubles.
Ep - expenses for the maintenance of narrow-gauge tracks:
Ep \u003d 800 * 2 * 200 \u003d 320,000 rubles.
ΔEdop \u003d 6000 + 7050 + 320000 \u003d 333050 rubles.
In this way,
ΔEgo = 602545754 + 411345 + 4500 - 333050 = 602628549 rubles. = 602.629 million rubles
1.2. Calculation of capital investments.
In this case, the amount of savings in capital investments will be:
ΔK = Cl + Kv + Kst,
Kl - savings in capital investments in the locomotive fleet:
Cl \u003d (75/24) * 1.25 * 820000 \u003d 3203125 rubles.
Kv - savings in capital investments in the rolling stock:
Kv \u003d (0.10 * 2 * 50) / 24 * 1.1 * 58500 \u003d 26812.5 rubles.
Kst - savings in capital investments in the development of station tracks:
Kst \u003d (0.10 * 2 * 50) / 24 * 16.4 * 3.5 * 0.7 * 2500 \u003d 41854.167 rubles.
ΔK \u003d 3203125 + 26812.5 + 41854.167 \u003d 3271792 rubles.
In this way,
ΔЗ \u003d 602628549 + 0.15 * 3271792 \u003d 603119318 rubles. = 603.12 million rubles
Task #3
Condition:
Profitability ratio (comparison rate 10%), duration of the investment process - 2 years.
Exercise: You must select a construction project.
Solution:
Project B requires more investment than Project A (60+5 – 20+40 = $5 million). However, the income stream in Project B will cover the investment within 2 years, while Project A will have a payback period of more than 3 years.
Moreover, within 5 years, the amount of profit on project A will reach only 73 million dollars, and on project B - 103 million dollars.
Thus, there are objective grounds for recognizing project B as more profitable, despite the initially large amount of investment compared to project A.
CONCLUSION
In a market economy, there are quite a lot of investment opportunities. At the same time, any enterprise has limited free financial resources available for investment. Therefore, the task of optimizing the investment portfolio arises.
A very significant risk factor. Investment activity is always carried out in conditions of uncertainty, the degree of which can vary significantly. Thus, at the time of the acquisition of new fixed assets, it is never possible to accurately predict the economic effect of this operation. Therefore, decisions are often made on an intuitive basis.
Making decisions of an investment nature, like any other type of management activity, is based on the use of various formalized and non-formalized methods. The degree of their combination is determined by various circumstances, including those of them, as far as the manager is familiar with the available apparatus applicable in a particular case. In domestic and foreign practice, a number of formalized methods are known, the calculations using which can serve as the basis for making decisions in the field of investment policy. There is no universal method suitable for all occasions. Perhaps management is still more of an art than a science. Nevertheless, having some estimates obtained by formalized methods, even if to a certain extent conditional, it is easier to make final decisions.
The process of making managerial decisions of an investment nature is based on the assessment and comparison of the volume of proposed investments and future cash receipts. Since the compared indicators refer to different points in time, the key problem here is the problem of their comparability. It can be treated differently depending on the existing objective and subjective conditions: the inflation rate, the size of investments and generated revenues, the forecasting horizon, the skill level of the analyst, etc.
LIST OF USED SOURCES
1. Wynn R., Holden K. Introduction to econometric analysis. - M.: Finance and statistics, 1991.
2. Volkov B.A. Economic efficiency of investments in railway transport in market conditions. - M.: Transport, 1999.
3. Vodyanov A.A. Investment processes in the economy transition period. (Methods of research and forecasting). - M.: IMEI, 1998.
4. Issues of state regulation of the economy: main directions and forms // Marketing in Russia and abroad, 2000. - No. 5.
5. Dontsova L.V. The system of regulation of investment processes in developed countries // Marketing in Russia and abroad, 1999 - No. 4.
6. Egorova E.N., Petrov Yu.A. Comparative analysis of foreign tax systems and development of taxation in Russia. - M.: CEMI RAN, 2000.
7. Tax policy in industrial countries. Collection of reviews. - M.: INION RAN, 1995.
8. Complete collection of codes Russian Federation. With amendments and additions as of May 1, 2002. - M .: LLC Firm AST Publishing House, 2002.
9. Complete collection of laws of the Russian Federation. With amendments and additions as of August 1, 2002. - M .: LLC Firm AST Publishing House, 2002.
Investment activity at the enterprise takes place in the process of implementing one or more investment projects . In the economic literature, the term investment project means a set of documents reflecting the economic feasibility and efficiency of investing money (capital) in tangible and intangible entities in order to maintain and expand production. It includes a rationale for economic efficiency, volume and timing of capital-forming investments, the necessary design and estimate documentation.
An investment project has three stages in its development: pre-investment(from the moment the entrepreneurial idea arises to the decision to invest), actually investment stage and operational- beginning production operation investment object and ending with its planned liquidation. These stages make up investment project life cycle.
Justification of the economic feasibility of an investment project includes determining its economic efficiency, feasibility and reliability.
Distinguish between the effectiveness of the project as a whole and the effectiveness of participation in the project.
Project efficiency includes public (socio-economic) efficiency and commercial (general economic) efficiency. With its help, the attractiveness of the project for its possible participants is assessed and the search for investors is carried out.
Public (socio-economic) efficiency takes into account the socio - economic consequences of the implementation of the investment project for society as a whole. It includes not only the immediate results and costs of the project, but also "external" costs and results in related sectors of the economy, environmental, social and other non-economic effects.
Commercial (general economic) efficiency investment project takes into account the financial consequences for its participant, provided that he makes all the costs necessary for the implementation of the project from his own funds and uses all its results.
Participation Effectiveness correlates the benefits and costs of each participant (subject) of the investment project (investor, customer, contractor, user of the capital investment object) and economic structures that are not a direct participant in the project. It includes:
the effectiveness of participation in the project for its participants (investors, customers, contractors, users of capital investment objects);
the effectiveness of investing in the company's shares;
project efficiency for economic structures that are not a participant in the investment project, including:
regional and national economic efficiency - for individual regions and National economy RF;
sectoral efficiency - for individual sectors of the national economy, financial and industrial groups, associations of enterprises and holding structures;
budgetary efficiency - for budgets of all levels and state non-budgetary funds.
Feasibility of the investment project characterizes the possibility of its implementation in the existing state of the internal and external environment of the enterprise. The most important for the economic evaluation is the financial component of feasibility, which means that the investment project can be implemented only if the necessary amount of money is available at the time when the investment is made. If the investment is funded by borrowed money then financial feasibility, in addition to the ability to take a loan in the required amount, provides for the cost of the loan. A loan that is too expensive can absorb all the benefits of an investment project and even make it unprofitable.
Economic evaluation of investments is carried out on the basis of indicators calculated using the discounting technique. This technique takes into account the time factor.
1) When assessing the economic efficiency of investment projects, a direct comparison of the nominal value of investments and income from them gives distorted results, since these cash flows are several years apart.
Discounting allows you to evaluate date of discounting (reduction) values relating to other points in time - determine their present value – DS:
DS (C) \u003d C * (1 + r) - n,
С – estimated cost, rub.; DS - cost estimate on the date of discounting (reduction), rub.; r is the discount rate; n is the time period between date discounting and the date of existence of the estimated value (year, quarter, month).
The factor (1 + r) - n , with the help of which the multi-temporal values are brought to a comparable form - are estimated at the discounting date, is called discount factor.
The discounted values can be summed up. This allows you to determine the total estimate of both expenses (for example, the costs of capital investments spaced over time) and the total estimate of income.
In practice, the most common discounting date is the current time. An indicator characterizing such an assessment , is the current present value (TDS), which underlies the calculation of most indicators of the economic efficiency of investments.
Net Present Value (NPV)- one of the main indicators of the economic evaluation of investments. Its calculation is based on comparing discounted expenses with income.
NPV \u003d Σ TDS (D) - Σ TDS (I),
where - D - income for each period of the investment project, I - expenses for each period of the project.
The value of the net present value reflects the increase in the income of the enterprise in the event of the adoption of the investment project. In case of refusal to implement the investment project, the funds will be used in some kind of economic turnover - in the so-called investment alternative. Under investment alternative the other most probable variant of the use of funds directed to investments is understood. For example, funds, instead of investments in fixed assets, will be placed in a bank on a deposit account at 10% per annum. If these 10% per annum are used as discount rate - r = 0.1, then when calculating net present value investment project, the resulting value will show how much more income from this project will be than from placing money in a bank.
A positive net present value means that, during its economic life, the investment project:
reimburse the costs incurred;
will provide income in the amount of 10% - the same as from bank deposit(i.e. will receive income equal to income from its investment alternative);
will receive additional income equal to the net present value.
With NPV = 0, the income of the investment project and its investment alternative (income from placing money in a deposit account) are the same. The negative value of NPV shows that the investment alternative is more efficient, although the investment project may have some profit.
When calculating discounted indicators, the most important is the correct definition discount rates. As the minimum value (barrier rate) of the discount rate, the profitability of the possible alternative use of funds in case of refusal to invest is used. For agricultural enterprises, an alternative to investment in most cases is the use of cash in existing production activities. The definition of the discount rate in this case is based on the planned profitability, taking into account inflation. Inflation is taken into account if the investment project is calculated in forecast (deflated) ) prices. If current prices are applied, inflation is not taken into account in the discount rate.
The most common relative indicator of the economic efficiency of investments is profitability index(IR) . It characterizes how much the return on "initial" investments (for example, capital investments) is higher than that of the investment alternative. This indicator is calculated as the ratio of the sum of current discounted income (D) to the sum of current discounted investment costs (I).